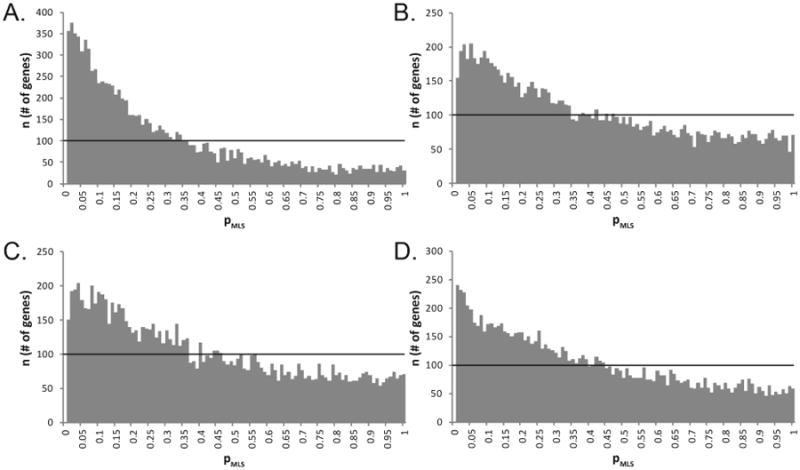
Figure 2. Distribution of p-values (pMLS) suggests de facto relationship between protein homology and MLS.

The distribution of p values for the slope of the regression model with MLS as the independent variable of interest for univariable (a), multivariable including confounders (b), SpeakmanGL (c), and SpeakmanBW (d) models is shown. For each model, smaller p-values are over-represented compared to the uniform distribution expected for the case where alignment score and MLS are truly unrelated. The uniform distribution for this data is represented by the horizontal line.
