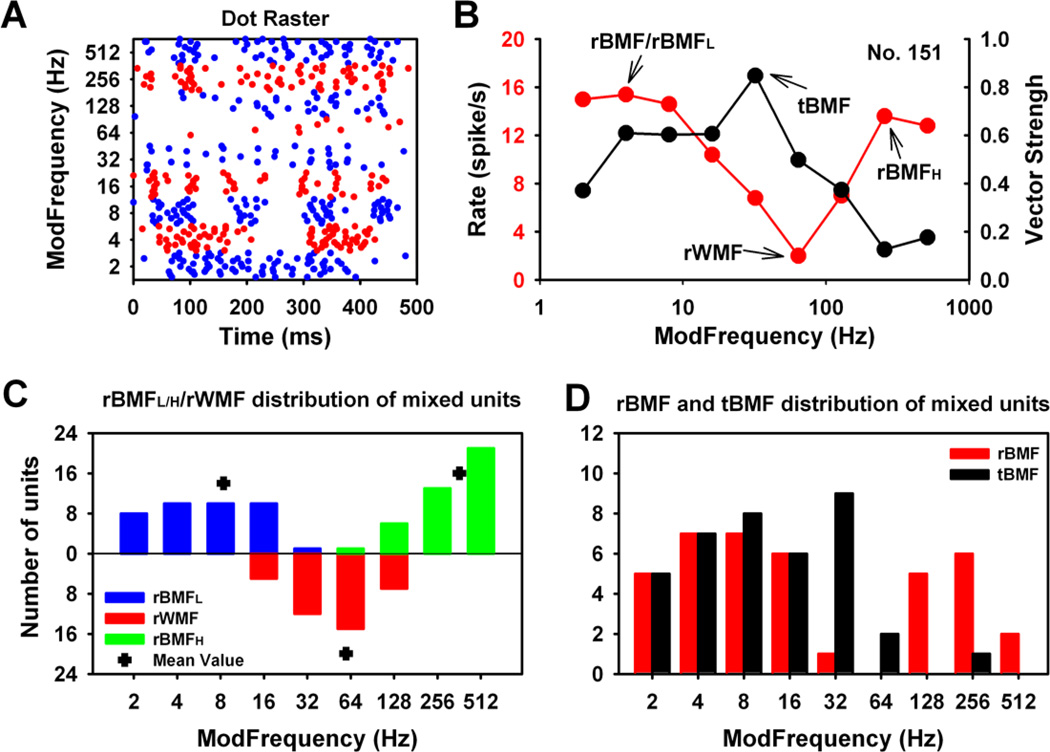
Figure 1. Basic response properties of the Mixed units in the MGB.
(A). Dot raster of a representative Mixed MGB unit. Time-locked responses were seen for lower fms while non-synchronized responses were shown for higher fms. Typical for the Mixed MGB units, a clear transition minima was seen in the area around 64 Hz. (B) Modulation transfer function curves for this representative unit showed clear transitions between lower and higher fms in both rMTF and tMTF. (C) Group data showed that the distribution of the rBMFs and rWMFs followed the shape of the Mixed units’ rMTF. Lower rBMFs range between 2 Hz and 32 Hz (mean = 8.4 Hz), higher rBMFs range between 64 Hz and 512 Hz (mean = 363.7 Hz). Minimum transition frequencies were between 16 Hz and 128 Hz, with few or no responses at rWMFs. (D) The distribution of the absolute rBMFs (the highest rMTF peak). As expected, the distribution of tBMFs was focused on the lower fms.

