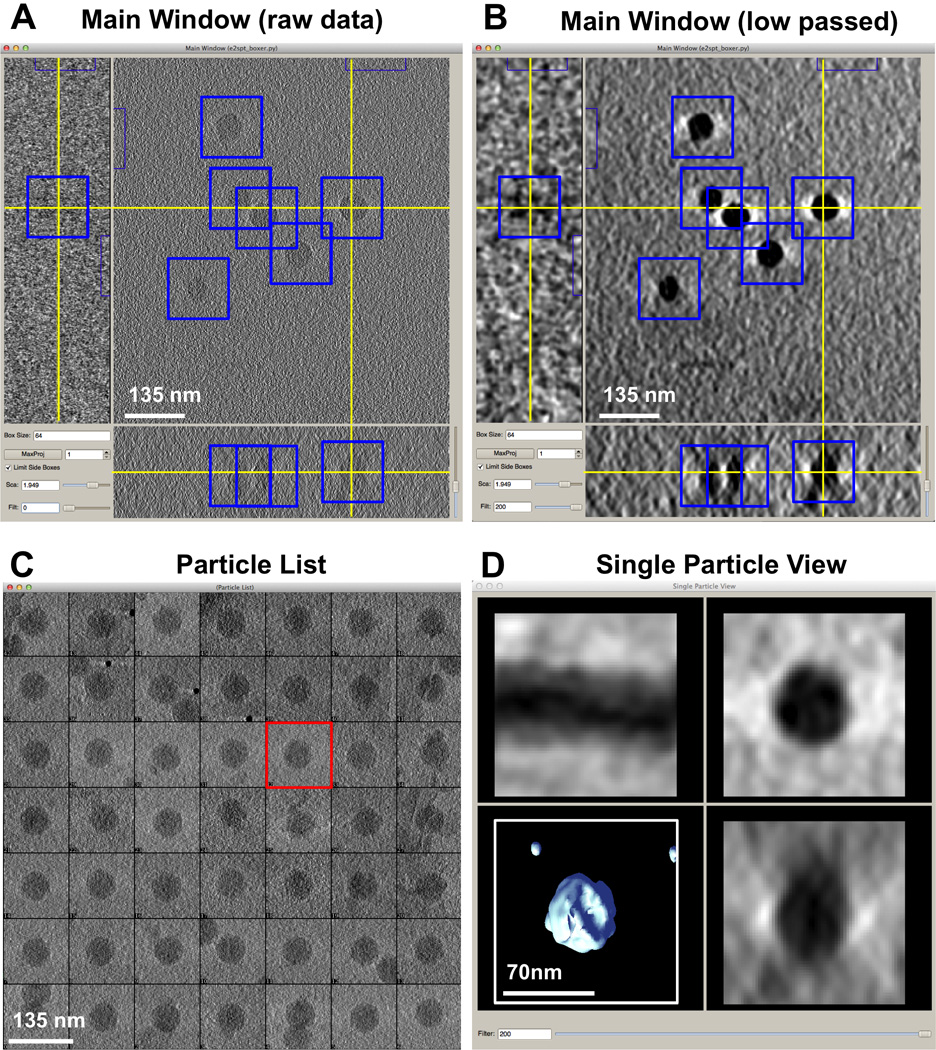
Figure 2. ε15 virus visualized in EMAN2’s 3-D particle picking GUI for SPT.

A) Main Window of the Graphical User Interface (GUI) provided by e2spt_boxer.py for subtomogram selection, showing three ~21Å thick orthogonal slices through a representative cryoET raw tomogram of ε15 in vitro. Blue boxes outline the subtomograms picked so far; the yellow cross denotes the center of the subtomogram currently selected. B) Same as A) but using the dynamic filter (bottom left of the Main Window) to lowpass the tomogram on the fly to 200Å. C) Particle List Window showing 2-D Z projections (X/Y plane) for all picked subtomograms (the subtomogram currently selected is outlined in red). D) Single Particle View Window showing three orthogonal projections and a 3-D interactive isosurface for the subtomogram currently selected, dynamically lowpass filtered to 200Å.
