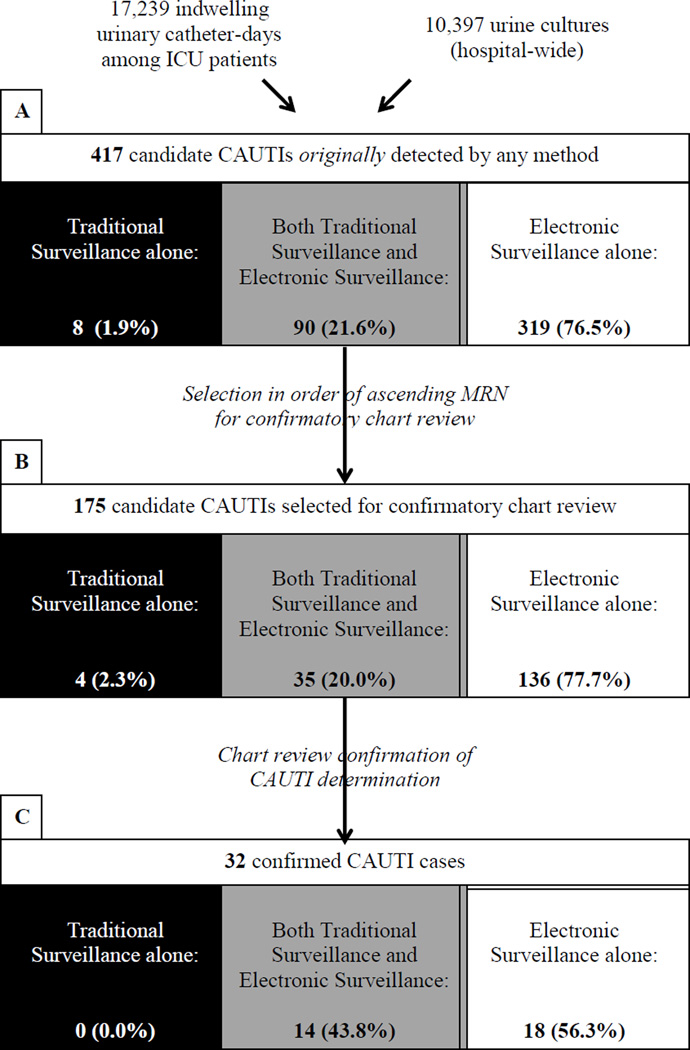
Figure 1. Case Ascertainment Flow Diagram.
Figure 1 is a flow diagram that indicates the number and proportion of candidate and confirmed CAUTI identified by alternative case ascertainment methods. Black shading indicates CAUTIs identified by traditional surveillance alone; gray shading indicates CAUTIs detected by both traditional surveillance and electronic surveillance; and white shading indicates CAUTIs identified by electronic surveillance alone. Section A shows the proportion of candidate CAUTI detected by traditional surveillance alone, electronic surveillance alone, or both methods (N=417). Section B and Section C indicate the breakdown of these ascertainment methods for candidate CAUTI selected for confirmatory chart review (N=175) and confirmed CAUTI (N=32), respectively. Abbreviations: ICU, intensive care unit; CAUTI, catheter-associated urinary tract infection; MRN, medical record number

