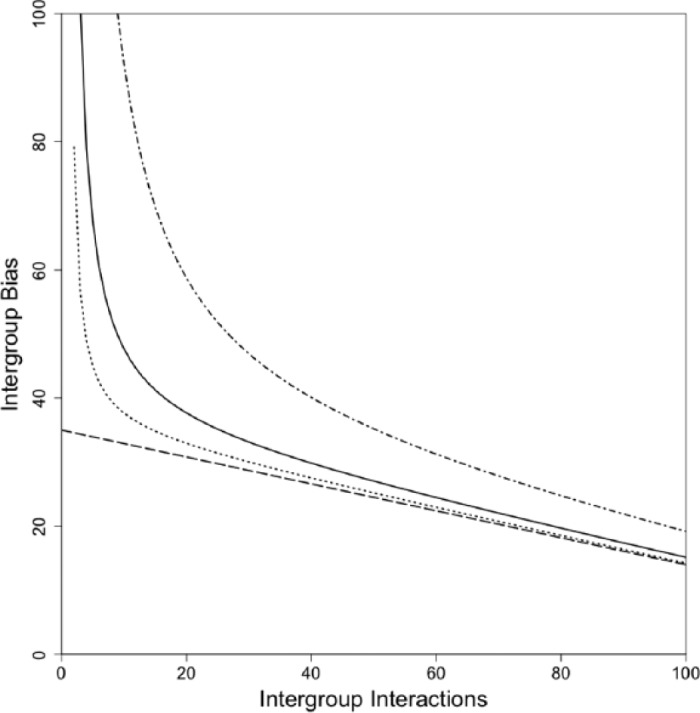
Fig. 1.

Graph representing the relationship between intergroup interactions and intergroup bias as an oblique asymptote. The dashed line represents the oblique asymptote. The dotted line represents the curve function under good conditions (e.g., multiple high-quality interactions with the same outgroup member with little time between interactions). The dotted-and-dashed line represents the curve under relatively poorer conditions (e.g., superficial interactions with different group members with a long time period between interactions). The solid line represents the curve function on average.
