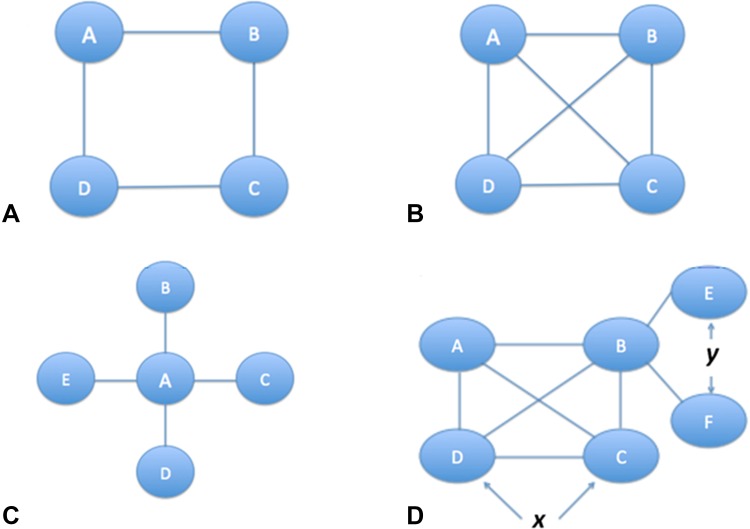
Fig. 3A–D.
Four network diagrams in increasing order of complexity are shown. The circles (nodes) represent treatments and the lines represent head-to-head trials (direct evidence). (A) This complex closed loop network shows that as more interventions are added without increasing linkages, the network indirectness increases. (B) This well-connected network shows that if an increase in interventions is complemented with an increase in linkages, then overall indirectness of the network may not increase. (C) A network with a single common comparator is called a “star” network. (D) Complex networks may have many linkages, although typically most studies have concentrated on only a few treatments comparisons. Parts of the network may be well-connected (as indicated by x), while other parts may be poorly connected (as indicated by y).

