Figure 3. Oxy133 induces osteogenic differentiation.
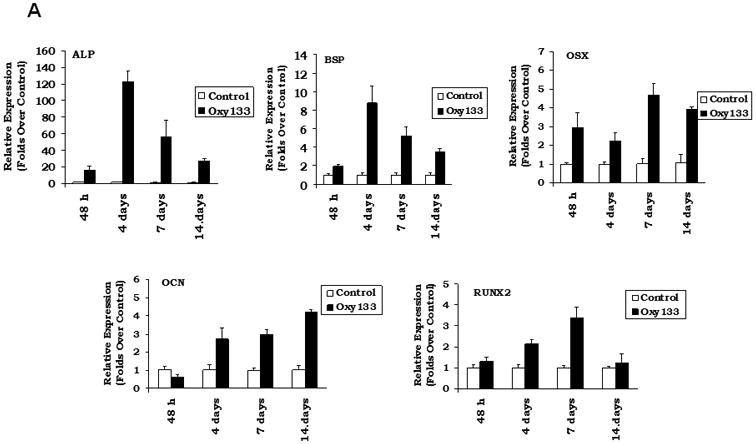
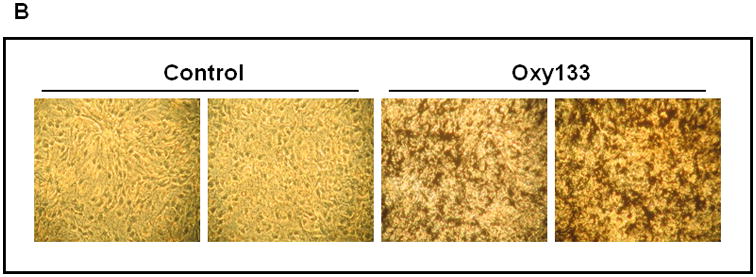
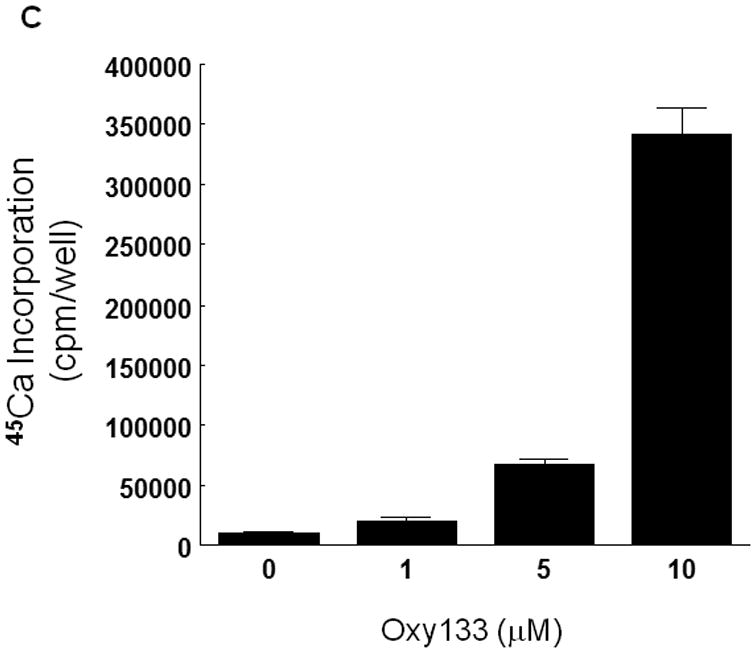
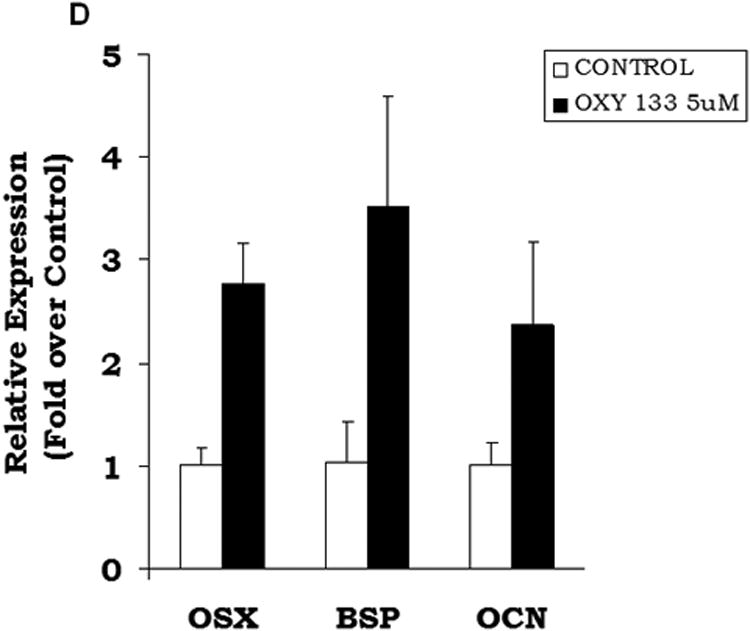
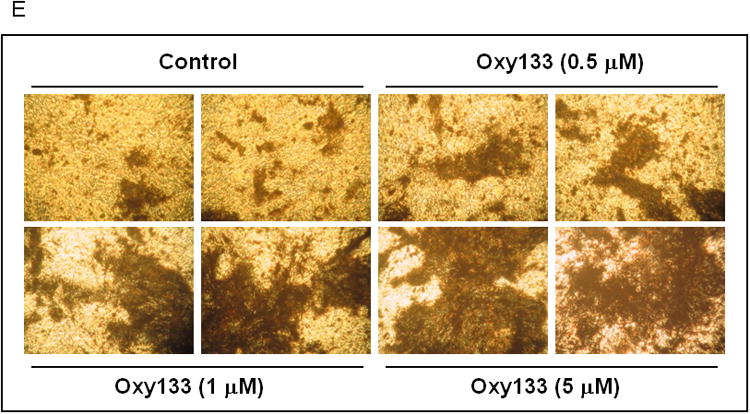
(A) C3HT101/2 cells at confluence were treated with control vehicle or 2.5 μM Oxy133 in osteogenic media. Expression of osteogenic genes Runx2, ALP, BSP, OSX, and OCN was measured by quantitative real-time PCR after 48 hours (48h), 4, 7, and 14 days of treatment. Results from a representative experiment are reported as the mean of triplicate determinations ± SD. (p<0.005 for control vs. Oxy133 at all time points for ALP, BSP and OSX and at 4, 7, and 14 days for Runx2 and OCN). (B) C3H10T1/2 cells were treated with control vehicle or 2.5 μM Oxy133 for 3 weeks. To examine extracellular mineralization von Kossa staining was performed and mineralized matrix appears as dark black staining under light microscopy (10×). (C) In parallel cultures to those described in (B), mineralization was quantified using a 45Ca incorporation assay (p<0.005 for control vs. all concentrations of Oxy133). (D) Primary human MSCs were treated in osteogenic medium with control vehicle or 5 μM Oxy133 for 4 weeks. Expression of osteogenic genes OSX, BSP, and OCN was measured by quantitative real-time PCR. Results from a representative experiment are reported as the mean of triplicate determination ± SD (p<0.05 for all genes in control vs. Oxy133 treated cells). (E) Primary human MSCs were treated in osteogenic medium with control vehicle or 0.5, 1, and 5 μM Oxy133 for 5 weeks. To examine extracellular mineralization von Kossa staining was performed and mineralized matrix appears as dark black staining under light microscopy (10×).
