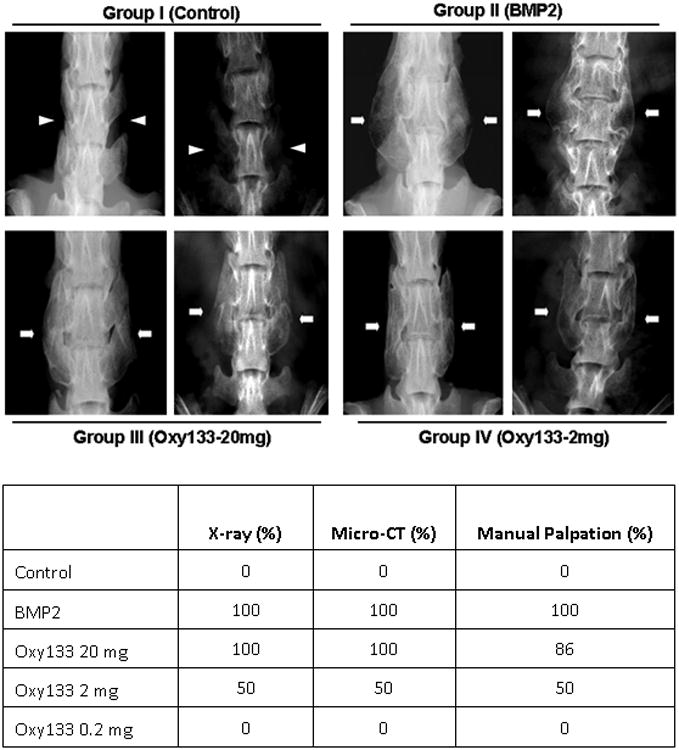
Figure 5. Plain radiographs of fusion masses and fusion rates in animals treated with rhBMP-2 and Oxy133.

Top panel: Faxitron images of two representative animals from the indicated groups at 8 weeks postoperatively are shown. Arrowheads signify lack of bone formation; arrows signify bone formation. Group I (Control); intertransverse process space with no bone formation. Group II (BMP2); bridging bone mass and bilateral fusion at L4–L5. Group III (Oxy133–20 mg); bridging bone mass and bilateral fusion at L4–L5. Group IV (Oxy133–2mg); bridging bone mass and bilateral fusion at L4–L5 in animals that showed induction of fusion by Oxy133. Bottom panel: fusion rates in animals treated with control, rh-BMP2 or Oxy133 as assessed by xrays, μCT, and manual palpation.
