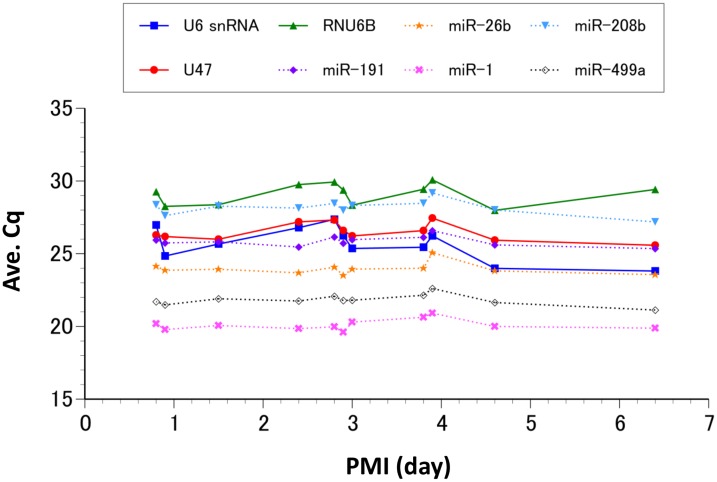
Fig 3. Detection of smRNAs in frozen tissues.
Average Cq values (Y-axis) of 8 smRNAs with various postmortem intervals (X-axis) are shown. Cq values for the miRNAs (dashed lines) appear to be more stable than those of other classes of smRNAs (solid lines). The mean value and standard deviation for each candidate smRNA are shown in Table 3.

