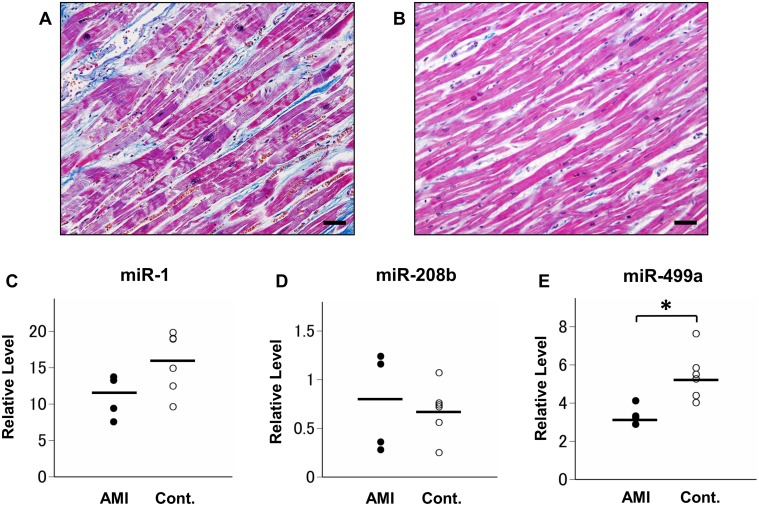
Fig 5. Quantified miRNA biomarker expression in postmortem AMI and control tissues.
Histopathological images of human cardiac tissue stained with Masson trichrome highlighting the dominant contraction band necrosis and low levels of neutrophil infiltration in the early phase of AMI (A) and the regular alignment of muscular fibers in the control tissue (B). Scale bar = 50 μm. Relative expression of miR-1 (C), miR-208b (D), and miR-499a (E) in four AMI and seven control cases after normalization to miR-26b and miR-191. *P < 0.05.

