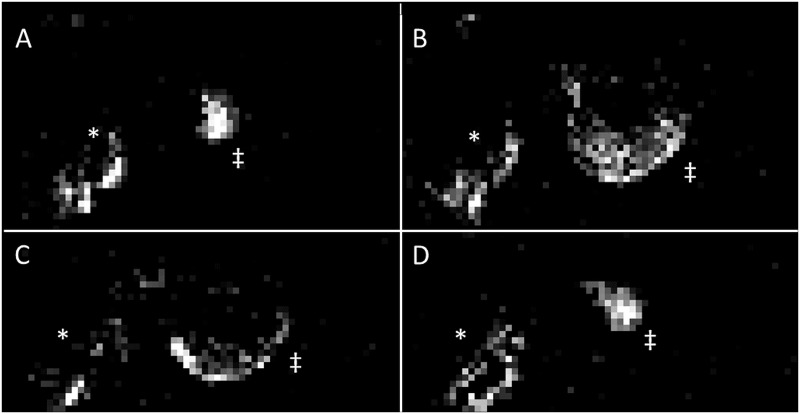
Fig 3. Evaluation of tumour blood flow following tumour immobilisation.
DCE-MRI was performed sequentially to CT in the same mice during the same anaesthetic session and using the same cradle. Pre-contrast enhanced images were subtracted from post-contrast images at 10 minutes p.i. to reveal gadolinium-avid tumour regions. A-D: The gadolinium uptake pattern for each 8th slice of the tumour is depicted. Results for the same mouse as featured in Fig 2 are shown. The animal’s body is indicated by a *, its tumour by a ‡.

