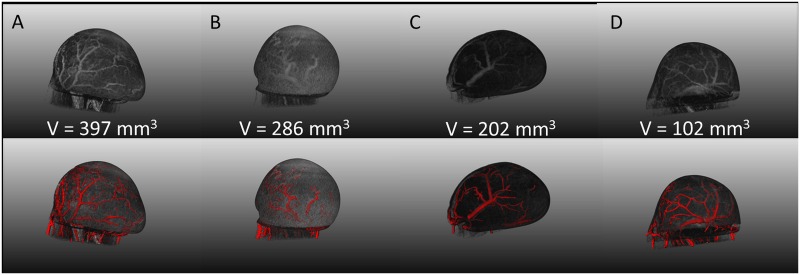
Fig 4. Tumour vessel image rendering.
Column A-D: A showcase of four representative mice, displaying a range in tumour volumes, is presented. 3D vessel segmentations based on intensity thresholding are portrayed in the top row and are overlaid with the tumour surface. The bottom row presents a composite image of the vessel segmentations with the vesselness map segmentation. Tumour ‘C’ portrays the same animal as shown in Fig 5.

