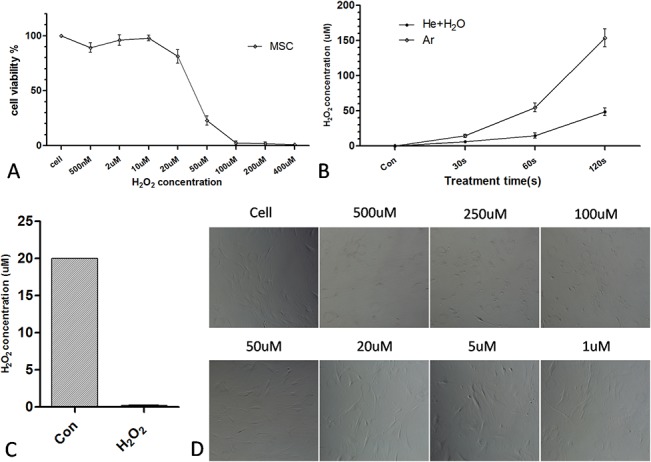
Fig 4. Contribution of H2O2 to plasma-induced cell death.

(A) Viability of MSCs treated with different concentrations of H2O2 for 24 h. (B) H2O2 concentration measured by the hydrogen peroxide assay after He+H2O and Ar plasma treatment for the indicated times. (C) H2O2 concentration measured relative to the control (20 μM H2O2 solution) after adding H2O2 scavenger. (D) Morphological changes in MSCs treated with indicated H2O2 concentrations for 24 h.
