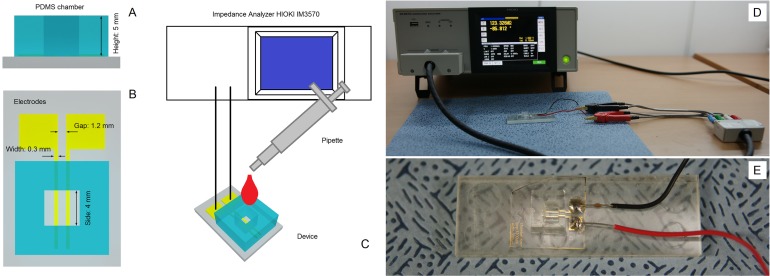
Fig 1. Schematic drawing of the device and experimental setup that were used to measure blood conductivity.
(A) Cross-section of the PDMS chamber. (B) Shapes and sizes of the gold-plated electrodes on the bottom of the chamber. (C) The appearance of the measuring system. Blood samples are loaded into the chamber using a pipette. (D) Photograph of the experimental setup. Calibration using air. (E) Photograph of the measuring PDMS chamber with two planar electrodes.

