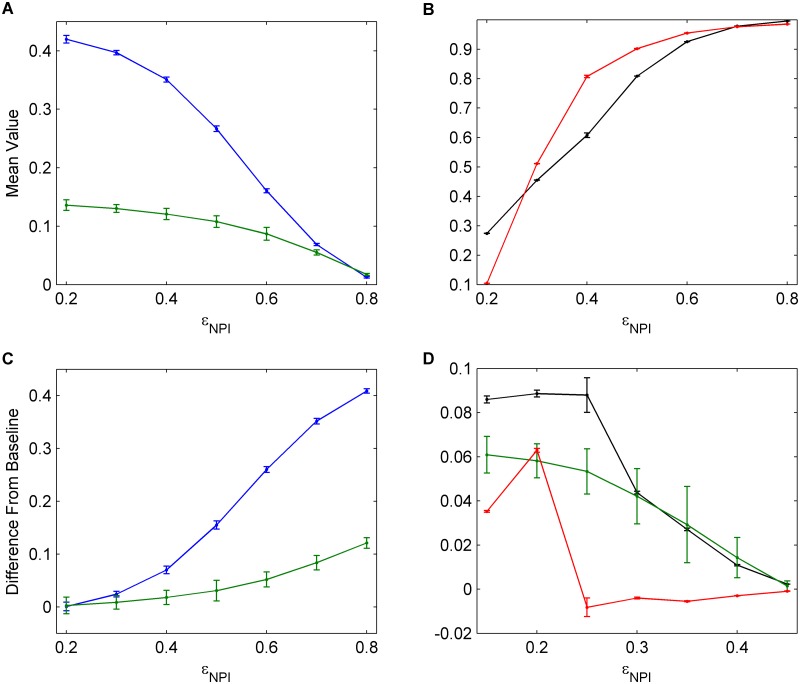
Fig 8. The effects of NPI efficacy.
(a), (b) Univariate sensitivity analysis for NPI efficacy, ϵ NPI. Data shows average values across 30 seasons for vaccination coverage (blue), incidence (green), NPI usage amongst susceptible individuals (black), and NPI usage amongst infectious individuals (red). (c), (d) Determining the amount that vaccination and NPIs interfere with each other for various NPI efficacies. Average values across 30 seasons for change in vaccination coverage (blue), change in incidence (green), and change in NPI usage amongst susceptible (black) and infectious (red) individuals are shown. Confidence intervals represent two standard deviations of the mean of the 100 parameter sets across 30 simulated seasons.

