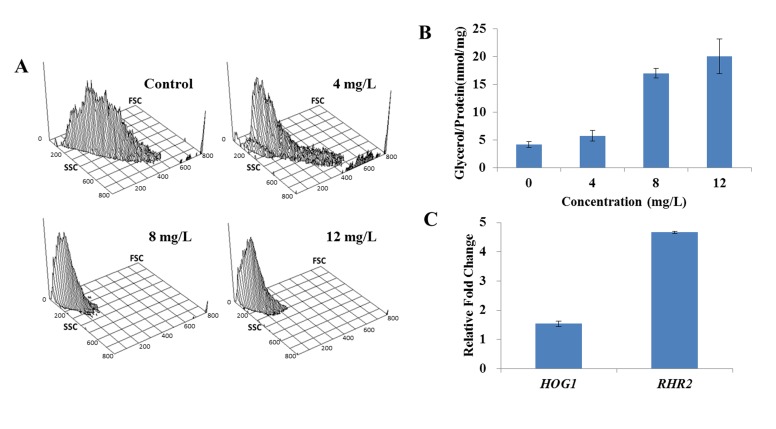
Fig 3. Effect of DD on the cell morphology and intracellular glycerol.
(A) The alterations of cell morphology were analyzed by flow cytometry. FSC (y-axis) is an indicator of size, SSC (x-axis) is an indicator of granularity and the z-axis represents the cellular population intensity. The values of x-axis and y-axis are linear and provide relative values for comparison among different treatments. (B) The contents of intracellular glycerol were measured using Glycerol Assay Kits after treated with various doses of DD for 3 h. (C) The total RNAs were extracted by the hot phenol method and the expressions of HOG1 and RHR2 were measured using qPCR. Bars indicate standard deviations.

