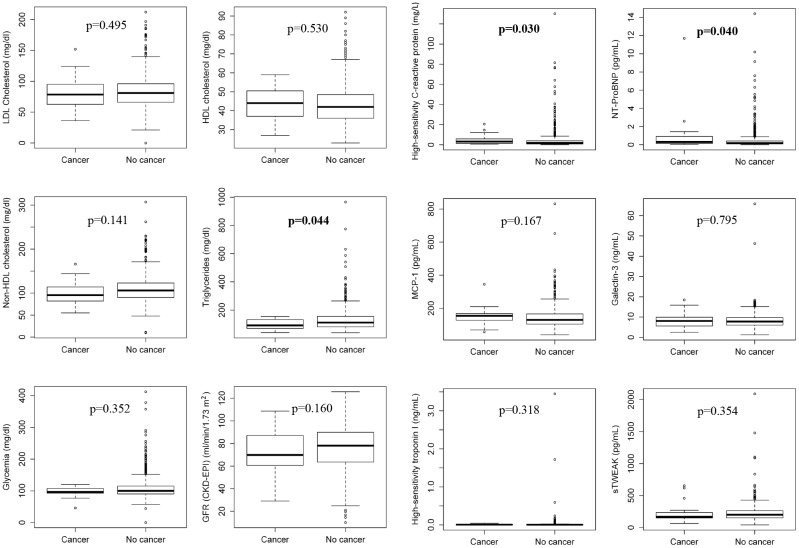
Fig 2. Box graphs showing data of the different analytical variables in patients with and without cancer.
Boxes represent the interquartile ranges, with a thick line inside representing the median value. Points outside boxes represent individual values that are not included in the interquartile range. CKD-EPI: Chronic Kidney Disease-Epidemiology Collaboration Method; GFR: Glomerular Filtration Rate; HDL: High-density lipoprotein; LDL: Low-density lipoprotein. NT-proBNP: N-terminal pro-brain natriuretic peptide; sTWEAK: soluble tumor necrosis factor-like weak inducer of apoptosis.

