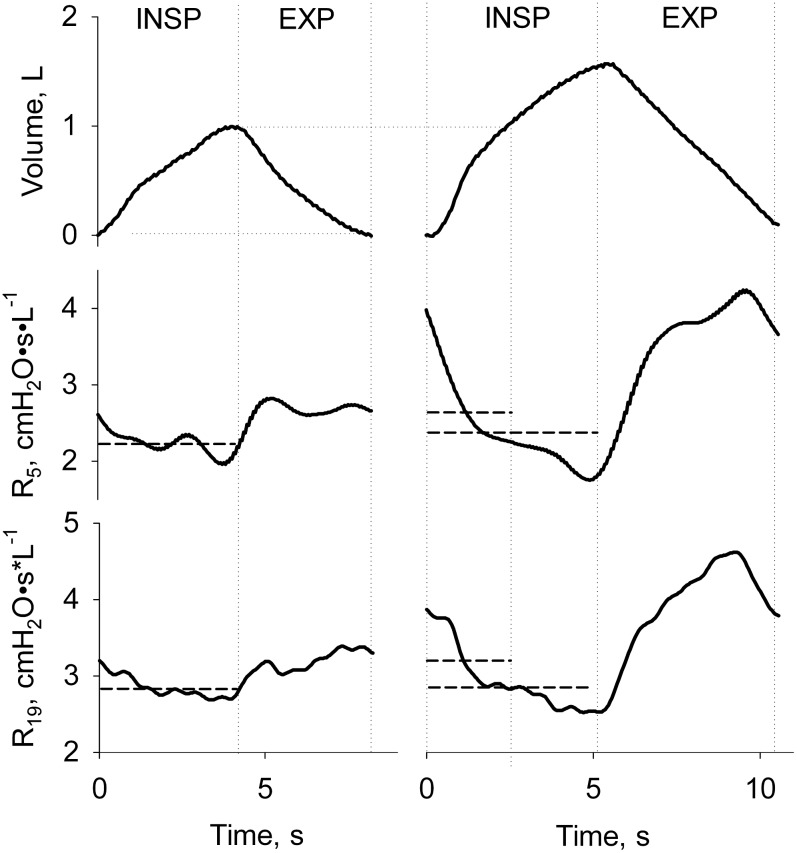
Fig 1. Typical example of measurements of airway resistance during tidal (left panels) and slow deep breathing experimental conditions (right panels).
Tidal volume and resistance at 5 (R5) and 19 Hz (R19) are shown as a function of time in the upper, mid, and lower panels, respectively. Direction of the inspiratory and expiratory phases is indicated. Vertical grey dotted lines from left to right identify the beginning and the end of tidal breathing as well as mid volume for the large breath. Horizontal gray continuous lines are average R5 and R19 measured over the whole inspiration or the portion of volume corresponding to tidal breathing. The latter are named R5-IsoVol and R19-IsoVol in the text.

