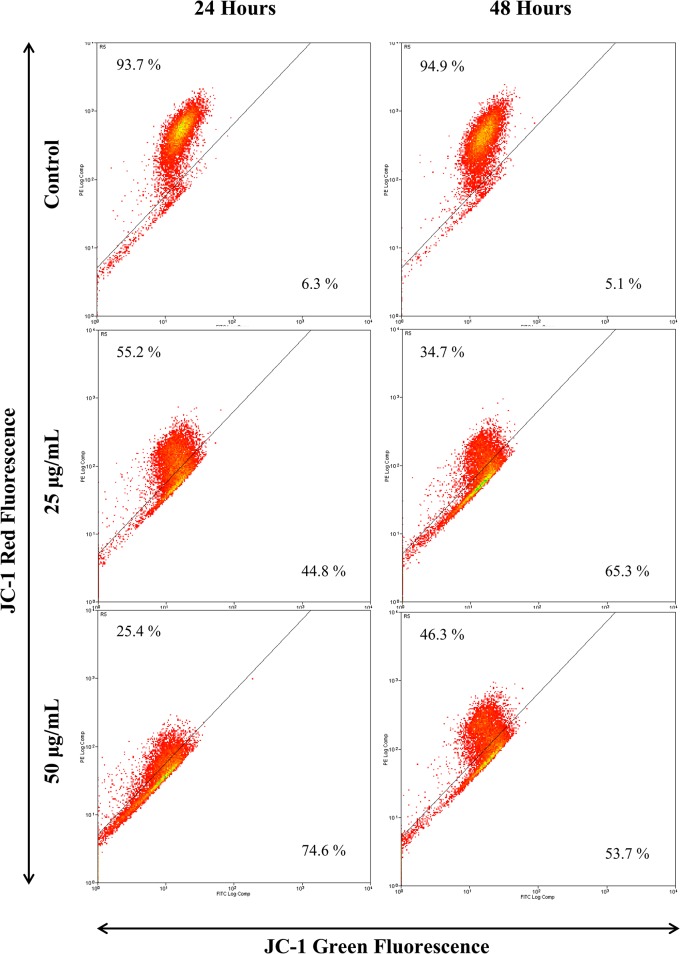
Fig 4. Mitochondria membrane potential of MCF-7 cells treated with EADs as determined by JC-1 fluorescent dye using flow cytometry analysis.
The increment of green fluorescence indicates the loss of ΔΨm in the mitochondria of EADs-treated MCF-7 cells. The data are presented as dot plots of JC-1 red fluorescence (Y-axis) against JC-1 green fluorescence (X-axis) of at least three independent tests.

