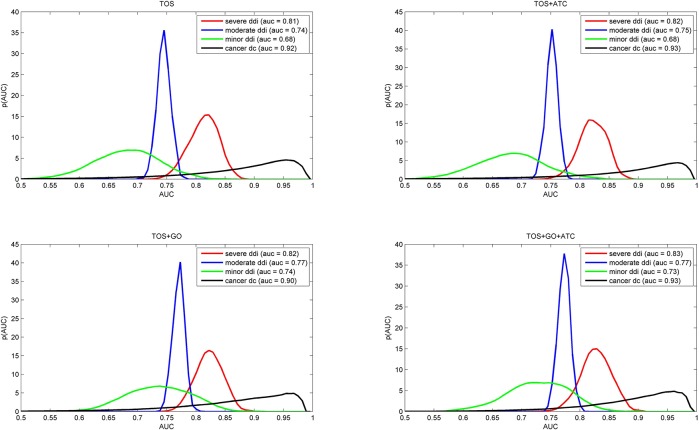
Fig 3. Performance of combined predictors on different training sets.
The short titles TOS, TOS+ATC, TOS+GO or TOS+GO+ATC refer to the combination used. The curves represent the AUC value distribution (as a probability density function) obtained via a kernel density estimation (KDE) approach. The data were obtained by a 5 fold cross-validation procedure described in Methods (section 4.5). Note that the distributions are quite similar to the TOS values (top left) which indicates that TOS effectively captures the drug combination phenomenon.

