
Fig 4. Scatter plot of TOS scores and Overall Response.
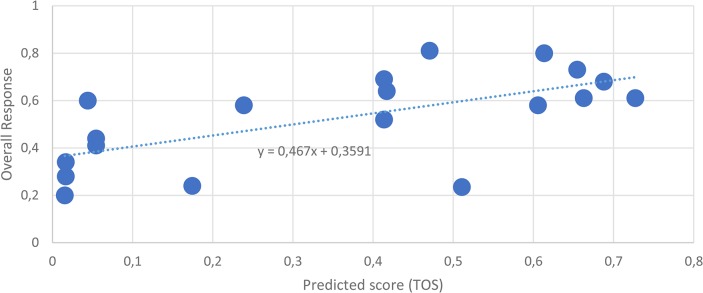
The predicted scores are on the x axes, the clinical outcome, Overall Response (for the definition of outcome measures see the RECIST [35]) are on the y axes. Each data point corresponds to a multicomponent combination. The generalized TOS score of multicomponent combinations was calculated as described in Data and Methods.