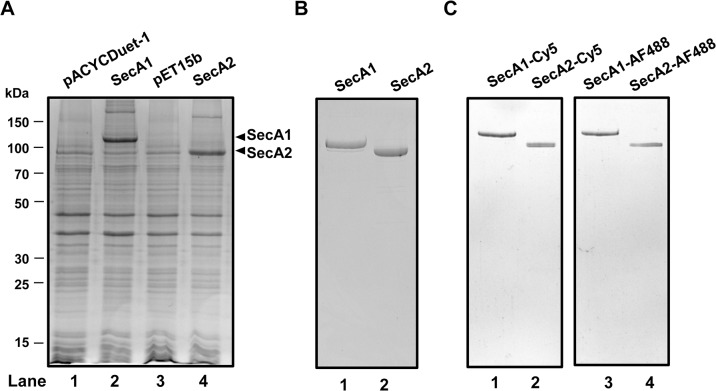
Fig 2. Overexpression, purification, and fluorescent labeling of M. tuberculosis SecA1 and SecA2.
A) Overexpression of M. tuberculosis SecA1 (lane 2) and SecA2 (lane 4) in E. coli BL21(λDE3) with a molecular mass of 105 and 85 kDa, respectively. Molecular masses of protein standard are indicated on the left. The empty vector, pACYCDuet-1 and pET15b, are shown as controls (lane 1 and 3). B) Coomassie-stained SDS-PAGE of purified M. tuberculosis SecA1 (lane 1) and SecA2 (lane 2). C) Visualization of fluorescently labeled SecA1 and SecA2 in SDS-PAGE by fluorescence imaging. SecA1 and SecA2 were labeled with the fluorescent probe Cy5 (lane 1 and 2) or AF488 (lane 3 and 4).

