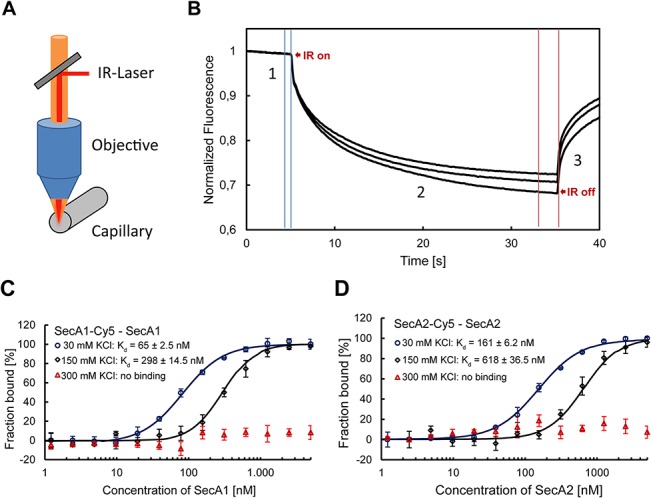
Fig 4. MST analysis of SecA1 and SecA2 homodimerization.

A) Scheme of the MST experiments and B) diffusion traces observed in MST. The mobility of molecules in a temperature gradient is followed by the fluorescence intensity in a central spot. When the IR-Laser is turned on, the initial fluorescence (1) drops due to the thermophoretic movement of fluorescently labeled proteins out of the heated spot (2). When the IR-Laser is turned off, back-diffusion of the fluorescently labeled proteins is observed which is driven by mass diffusion and depends on the hydration shell of the proteins (3). Dimers diffuse slower than monomers. SecA1 (C) and SecA2 (D) dimerization measured by MST. Unlabeled protein (1 nM to 10 μM) was titrated into a fixed concentration of labeled protein (25 nM). The thermophoretic signal is plotted as a function of the protein concentration resulting in a dimerization curve. The curves were fitted using the Hill-equation and apparent Kd values were determined. Error bars represent the standard error of 3 measurements. The apparent Kd for SecA1 and SecA2 dimerization at low salt concentrations were 65 ± 2.5 nM and 161 ± 6.2 nM, respectively. The measurement of samples at high salt concentrations showed no binding.
