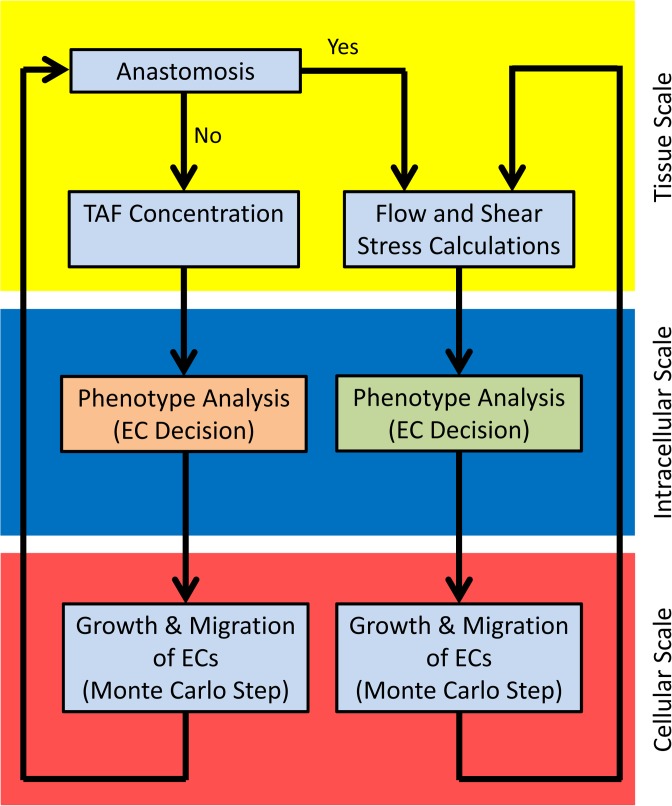
Fig 2. The solution procedure for the multiscale model.
The yellow zone represents the tissue scale, the blue zone is intracellular (molecular) scale, and the red zone is cellular scale. In intracellular scale, different signaling cascades are used for EC phenotype determination before and after anastomosis. In cellular scale, growth and migration of ECs are calculated with similar formulation before and after anastomosis; however, the constants in the formulations depend on the predicted phenotype.

