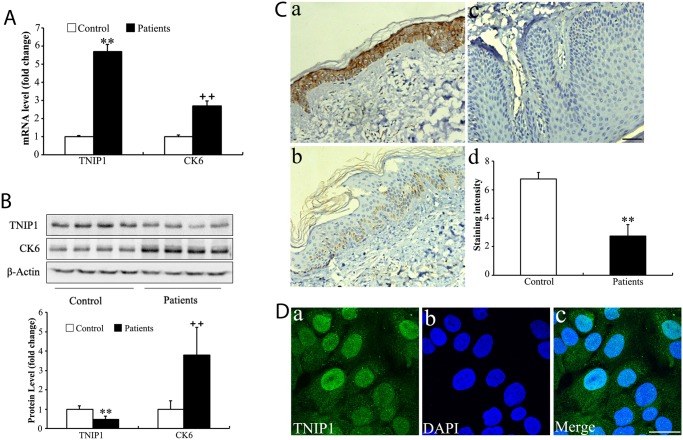
Fig 1. TNIP1/TNIP1 and CK6 expression in psoriatic lesions.
(A) Expression of TNIP1 and CK6 mRNA levels based on qRT-PCR in the epidermis of psoriatic plaque of patients with moderate to severe plaque psoriasis (n = 12) and the epidermis of normal controls (n = 12). Data shown represent mean ± SD; (B) Expression of TNIP1 and CK6 protein levels based on Western blotting in psoriatic plaque (n = 4) and controls (n = 4) skin. Data shown represent mean ± SD. (C) Tissue sections obtained from patients with psoriasis (n = 8; panel b and panel c) or from healthy controls (n = 8; panel a) were stained with mice anti-TNIP1 antibody and counterstained with hematoxylin. Bar = 100 μm. Staining intensity was scored in a semiquantitative manner by two independent observers. Data are presented as mean staining intensity grade ± SEM. (D) The distribution of TNIP1 in HaCaT cells identified by immunofluorescence staining. Bar = 30 μm. *, p<0.05; **, p<0.01.

