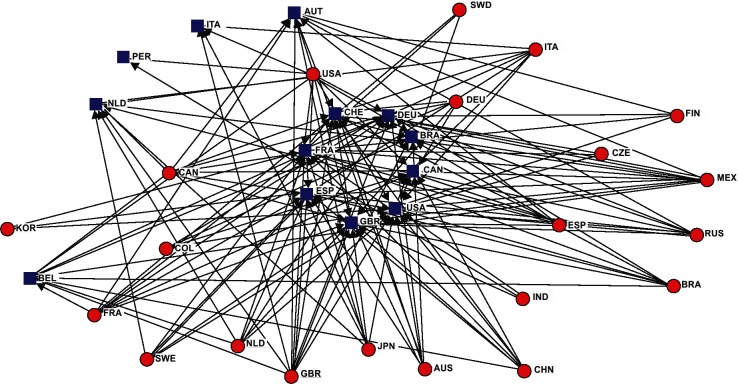
Fig 1. Collaboration Network, using Netdraw from UCINET.
We adjust the scaling/ordination from which we select the nearest Euclidian method. Note: We have positioned at the center of the "Fig. 1" the seven countries with the most relationships. Red circles correspond to countries of residence and blue squares to countries of scientific collaboration.

