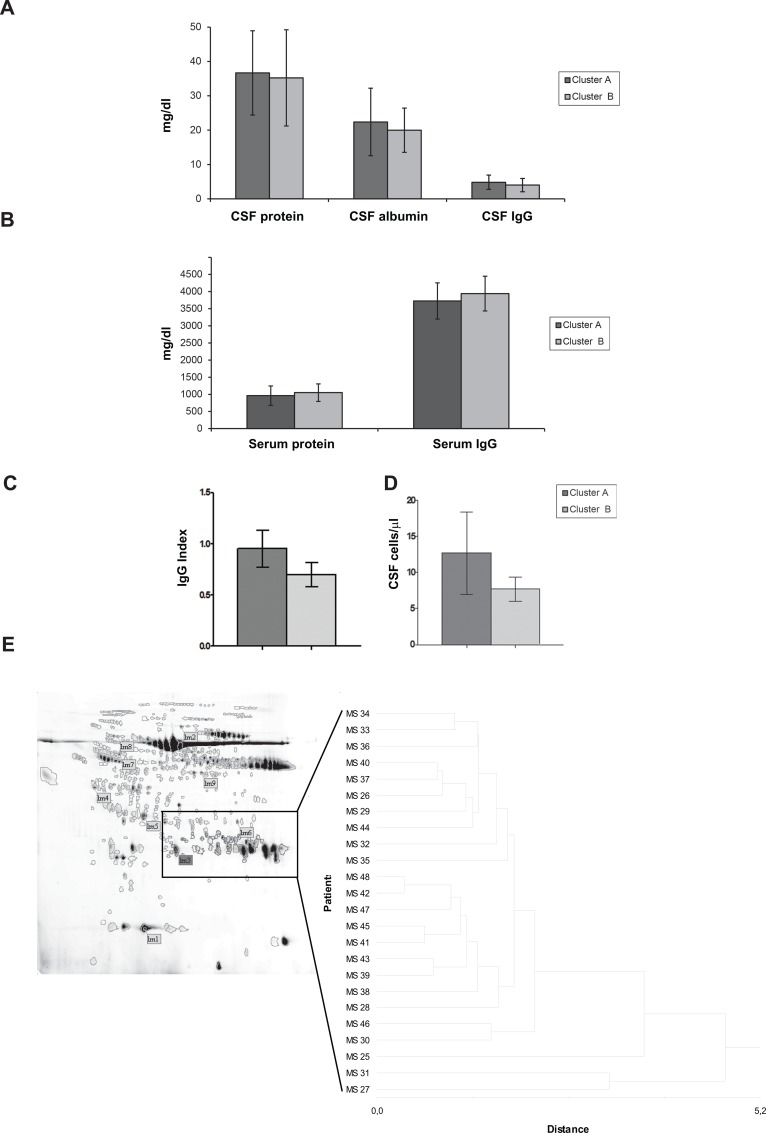
Fig 1. Biochemical features of CSF of patients in clusters A and Cluster B.
Column bar graphs representing the mean value ± SD of total protein, albumin and Immunoglobulin (IgG) content in the CSF (A) and serum (B), Ig Index (C) and number of cells/μl in the CSF (D) of samples from patients included in cluster A and B. The statistical analysis showed that there are no statistical differences between clusters A and B for the analysed parameters. (E) The hierarchical cluster analysis based on spot representing IgG proteins highlighted patients MS25, MS31 and MS27 as outliers.

