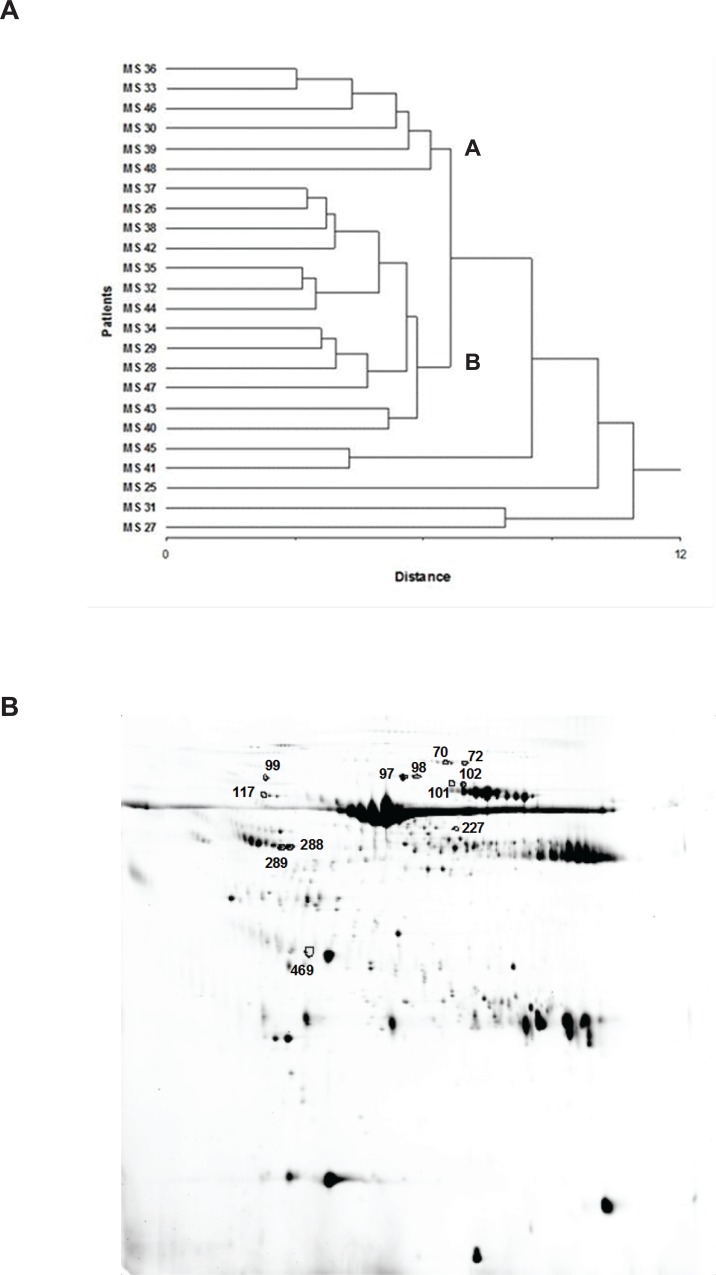
Fig 2. Cluster analysis based on 2-DE data from CSF gels and differently expressed spots.
(A) Hierarchical cluster analysis based on the %Vol values of the 239 most representative spots of the analysed gel population. For each spot, the mean value of %Vol was calculated considering the best two replicates (average SD lower than 30%) among 2-DE maps performed in triplicates. Two main clusters (A and B) and five outliers were identified. (B) A representative 2-DE map of CSF: differently expressed spots between cluster A and B are outlined in black.

