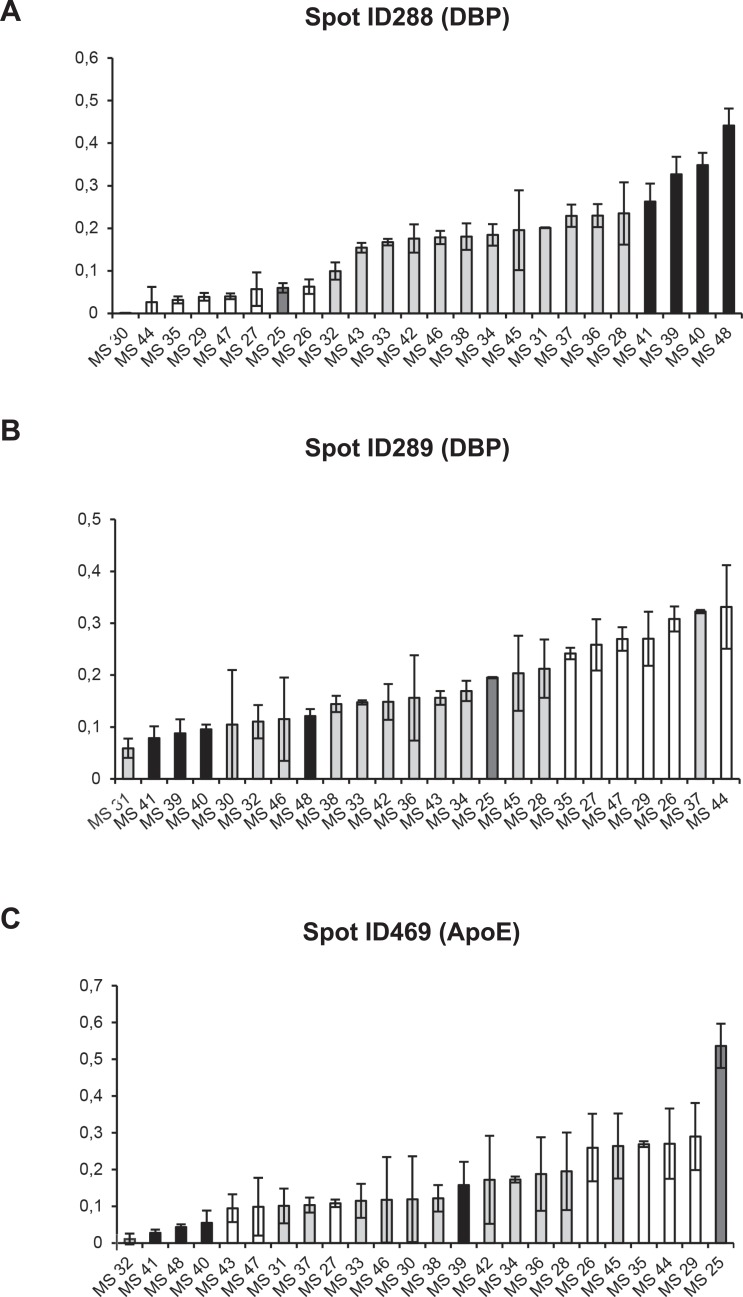
Fig 3. %Vol of spots ID288, ID289 and ID469 in individual patients.
Graphical representation of %Vol values of spots ID288, ID289 and ID469 showing the widest inter-individual range in the population studied (0,00–0,44; 0,06–0,33; 0,01–0,54 respectively). The %Vol values are expressed as the mean of at least three replicates ± SD.

