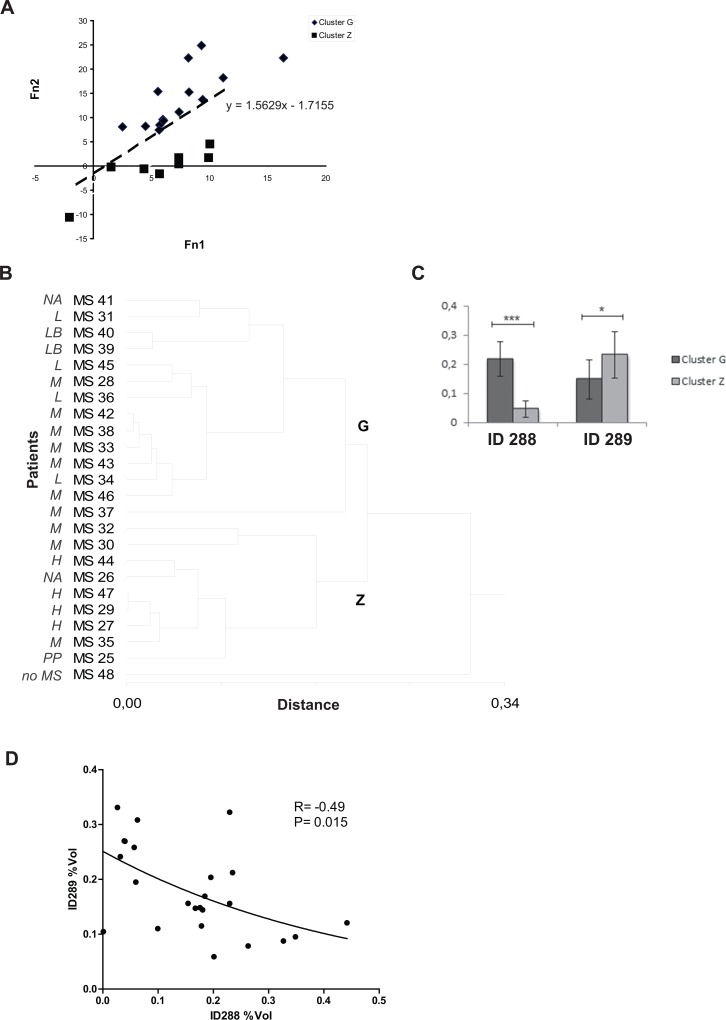
Fig 4. Two spot-based cluster analysis (spot ID 288 e ID 289).
(A) Graph showing the results of linear discriminant analysis based on the two linear functions (f1 = 33.813*(%Vol spot ID288) + 48.942*(%Vol spot ID289)– 7.155; f2 = 103.508*(%Vol spot ID288) + 42.871*(%Vol spot ID289)– 15.248) allowing optimal separation of clusters G and Z based on the measured variables (spot ID 288 and ID 289). The mathematical function separating the two groups is also reported. (B) Hierarchical cluster analysis based on the %Vol values of spots ID288 and ID289 identify two clusters, G and Z, and one outlier MS48. The clinical classification of the patients included in the study is indicated alongside the sample number: L = MS patients with a mildly aggressive disease; LB = MS patients with a benign form of the disease; M = MS patients with a moderately aggressive disease; H = MS patients with a highly aggressive disease; PP = MS patients with a primary progressive form of the disease; NA: patients lost to follow-up; no MS: patient with an unconfirmed diagnosis of MS. (C) Column bar graph shows %Vol values of spots ID288 and ID289 in clusters Z and G: values are expressed as the mean of three technical replicates ± SD (bars). * P<0.05, *** P<0.001 (Mann Whitney’s Test). (D) Spearman statistical analysis shows a significant inverse correlation between spots ID288 and ID289%Vol values for each subject (r = -0.49, p = 0.015).

