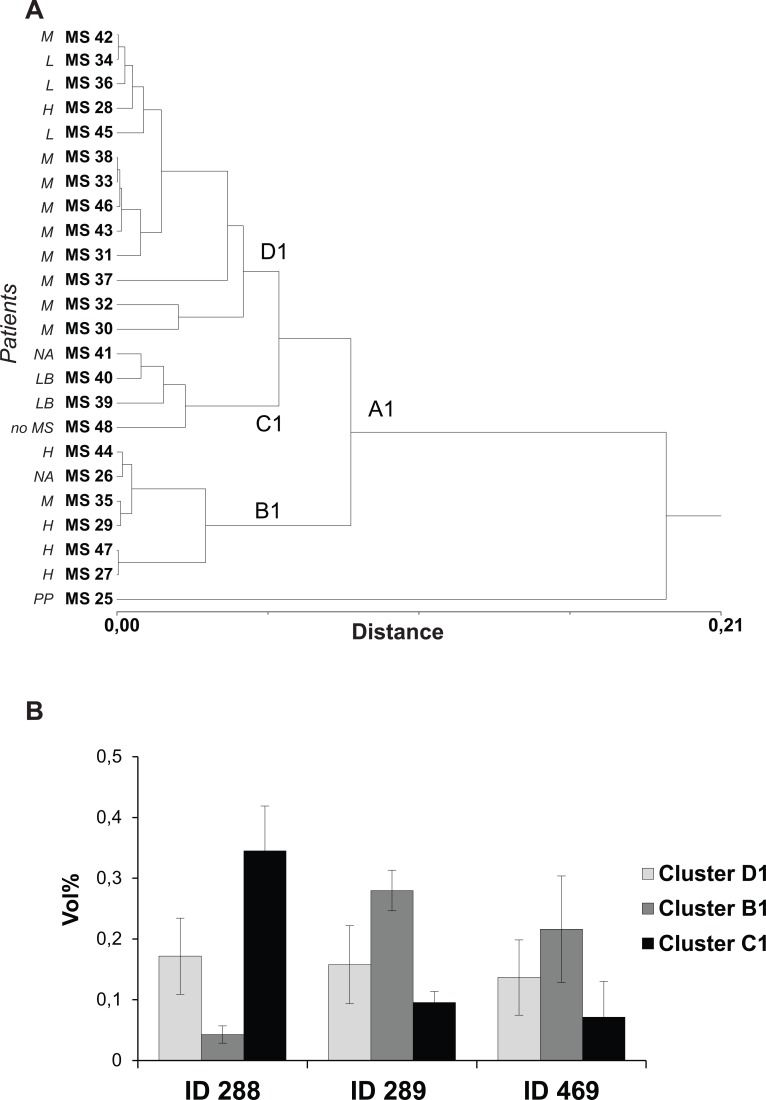
Fig 5. Three spot-based cluster analysis (ID 288, ID 289 and ID469).
(A) Dendrogram of the hierarchical cluster analysis based on the %Vol values of spots ID288, ID289 (DBP isoforms) and ID469 (ApoE), showing wider inter-individual range of %Vol values in the differently expressed spots. (B) Column bar graph showing %Vol values of spots ID 288, ID 289, ID 469 in clusters B1, C1 and D1. Values are expressed as the mean of the technical replicates ± SD (bars).

