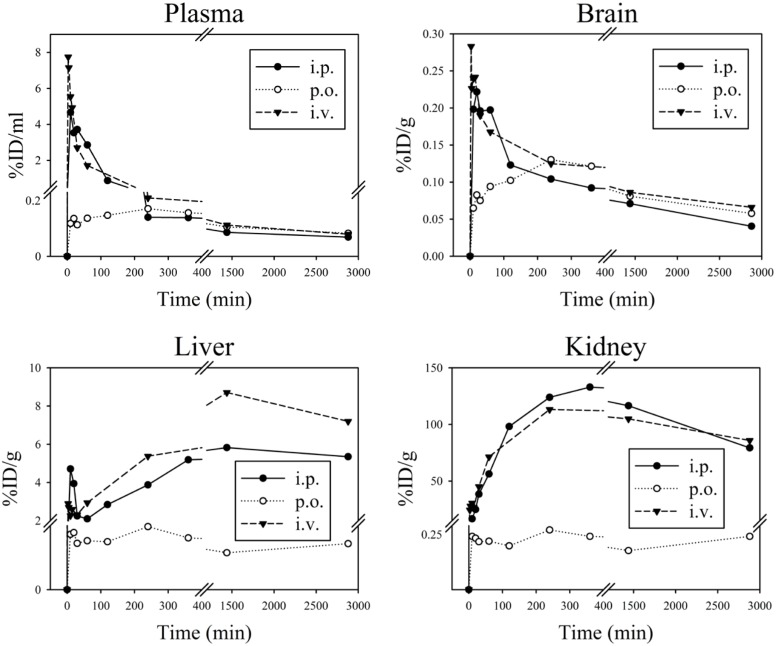
Fig 4. Mean pharmacokinetic profiles of 3H-D3 in organs and plasma after i.p., p.o. and i.v. administration.
3H-D3 (5 μCi) mixed with D3 in a total concentration of 3.5 mg/kg (i.v.) or 10.5 mg/kg (i.p. and p.o.) was applied per mouse. D3 concentrations are shown as percentage of injected dose per gram tissue or milliliter plasma (%ID/g or %ID/ml) dependent of time after administration. Mean values from 3 mice are shown.

