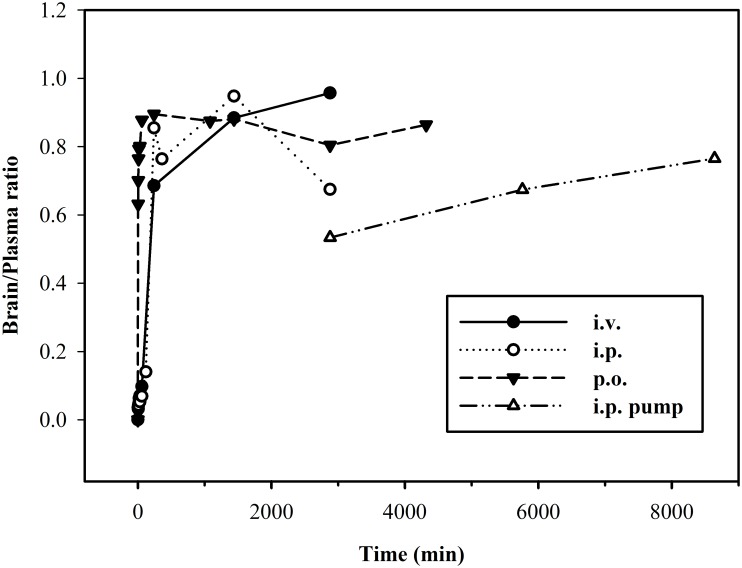
Fig 5. Temporal distribution of brain/plasma ratio of 3H-D3 after different administration routes.
Following bolus dose administration, low brain/plasma ratios were found at the starting time points. After 4 hours, the ratios reached relative high values and varied between 0.7–1.0. Upon i.p. pump implantation the ratio increased constantly with time.

