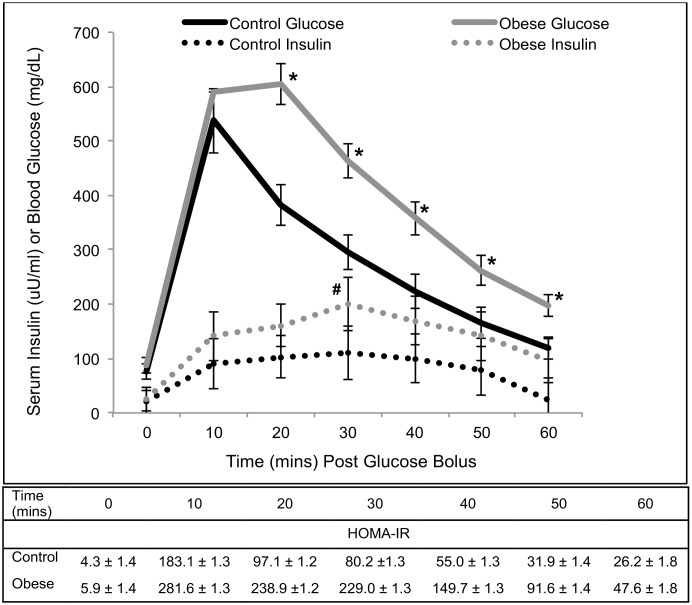
Fig 1. Intravenous glucose tolerance test in control (n = 9) and obese (n = 9) Ossabaw pigs.
Points on the obese pig glucose curve marked with an * are significantly greater than corresponding points on the control pig glucose curve (p<0.01). The insulin point on the obese pig curve marked with a # is significantly greater than the corresponding point on the control pig curve (p = 0.05). Obese pigs had greater HOMA-IR values at all post-glucose bolus points as compared with control pigs (p≤0.05).

