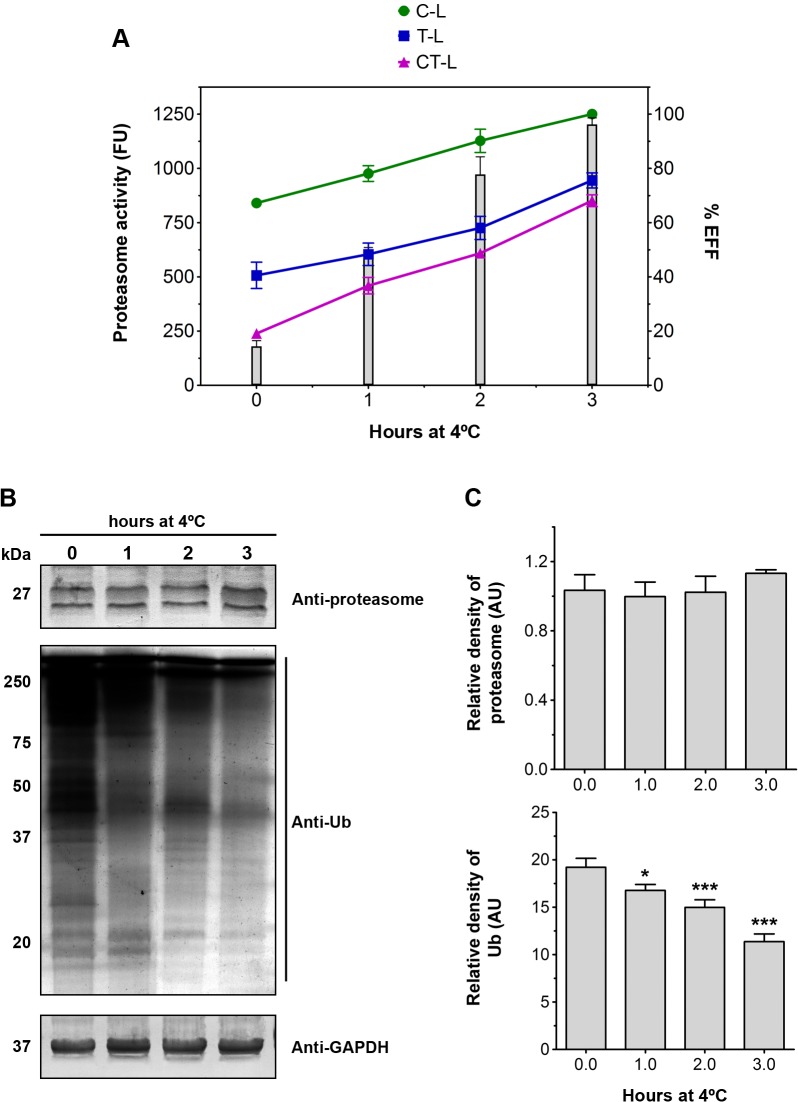
Fig 7. Proteasome proteolytic activity and the expression of ubiquitinated proteins during the EFF induction assay.
(A) Time-course of the trypsin-like (T-L), caspase-like (C-L) and chymotrypsin-like (CT-L) proteasome during EFF induction assays. T-L (•), C-L (■) and CT-L (▲) activities were measured by spectrofluorometry using the fluorogenic substrates Z-ARR-AMC, Z-LLE-AMC and Z-LLL-AMC, respectively. The peptidase activity assays were performed using samples of the TE fractions of parasites (1 X 10⁹ cells) from different times during the EFF induction assay. Data are expressed as means of fluorescence units ± SD across three independent experiments performed in triplicate. The three peptidase activities increased over the course of EFF induction (columns). (B) Immunoblot analyses of anti-proteasome and anti-ubiquitin antibodies. GAPDH was used as a loading control. (C) Densitometric analysis of blot of anti-proteasome and anti-ubiquitin antibodies. The results are normalised to the intensity of GAPDH bands and are expressed as the means of relative densitometry units ± SD across three independent experiments. The levels of proteasomal protein levels remained unaltered, whereas the ubiquitinated proteins decreased significantly during the course of EFF induction. *p < 0.05; ***p < 0.001 compared to time 0.0.

