
Figure 3.
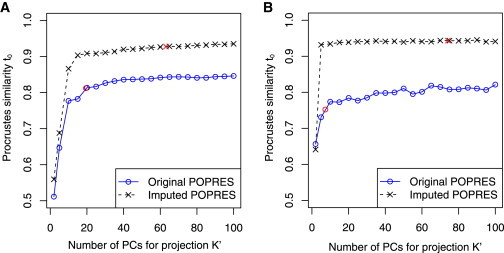
Performance of Trace and Laser Programs in Estimating Fine-Scale European Ancestry when using Different Number of PCs for Projection
The reference individuals and test individuals are the same as those used in Figure 2. K was fixed to 2 for all analyses. The x axis indicates the value of K′ = 2, 5, 10, 15 … 100. The y axis reports the Procrustes similarity t0 between coordinates estimated from subsets of markers to estimates based on genome-wide SNPs in Figure 2A.
(A) Performance of trace program on exome chip genotypes. Two red points indicate results when K′ is chosen as the number of significant PCs (p < 0.1, Tracy-Widom test); K′ ≈ 19.5 when using the original POPRES reference panel, and K′ ≈ 63.1 when using the imputed POPRES reference panel.
(B) Performance of laser program on simulated sequence reads at depths corresponding to ∼5% of the off-target coverage from exome sequencing experiments. Two red points indicate results when K′ is chosen as the number of significant PCs (p < 0.1, Tracy-Widom test); K′ ≈ 7.4 when using original POPRES reference panel, and K′ ≈ 74.2 when using the imputed POPRES reference panel.