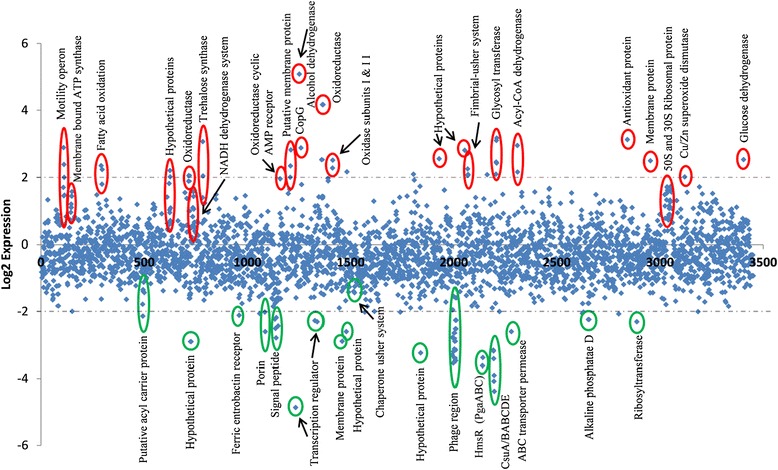
Fig. 8.

Differential expression of HiSeq RNA data of cpdA::Tn and 17978hm strains. Comparative whole transcriptome analysis was undertaken on the cpdA::Tn and 17978hm strains using the Illumina platform. Sequence reads were mapped to the reference ATCC 17978 genome and the differential gene expression calculated. Diamond markers indicate the differential expression levels of all predicted open reading frames of the ATCC 17978 genome and are sorted on the x axis according to the locus tag. Changes of 2-fold or more in gene expression were considered significant, up-regulated genes are identified in red and down-regulated genes in green. Dashed lines indicate 4-fold (log2 = 2) differences in expression. Genes of particular interest are circled, many of which are discussed in the body of the text
