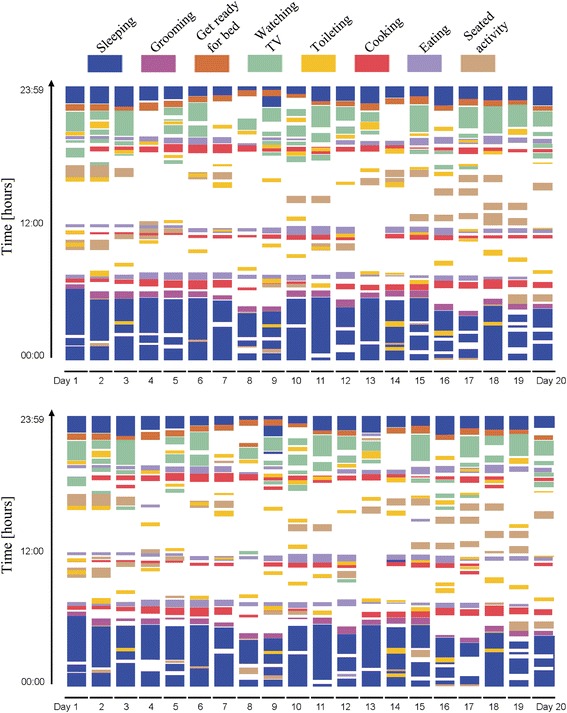
Figure 6.

Activity maps. Activity maps are qualitative means to visualize the recognized ADL. This activity map visualizes the ADL recognized from sensor data of a healthy female subject (age 75, Montreal Cognitive Assessment score 29) using CAR (above) in comparison with the RBI [23] (below) classifier.
