
Figure 3.
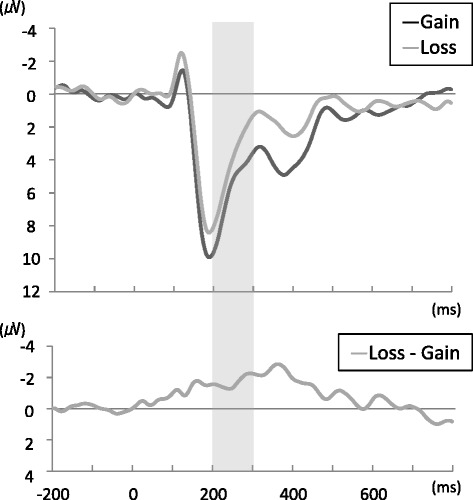
Grand mean ERP waveform. The upper graph shows the grand mean ERP waveform during presentation of gain and loss images, and the lower graph shows the subtracted (loss minus gain) ERP waveform. Gray-shaded areas represent the range of FRN. ERP, event-related potential; FRN, feedback-related negativity.