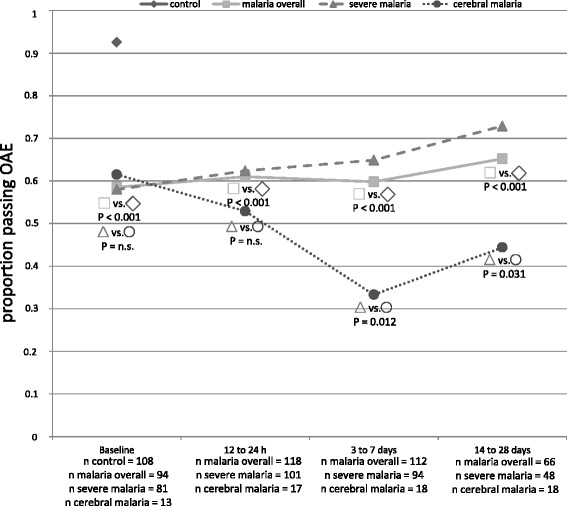
Fig. 1.

Passing proportions of the OAE. The proportion of passing individuals is shown for the four included groups in the y-axis (control group, all malaria patients, severe malaria without neurological symptoms, cerebral malaria). The x-axis shows the different measurement time points. The number of included patients for each group is added in the labeling of the x-axis. The filled symbols indicate the proportion of passing individuals in each group. The blank symbols indicate which figures have been compared for the p-values included in the figure
