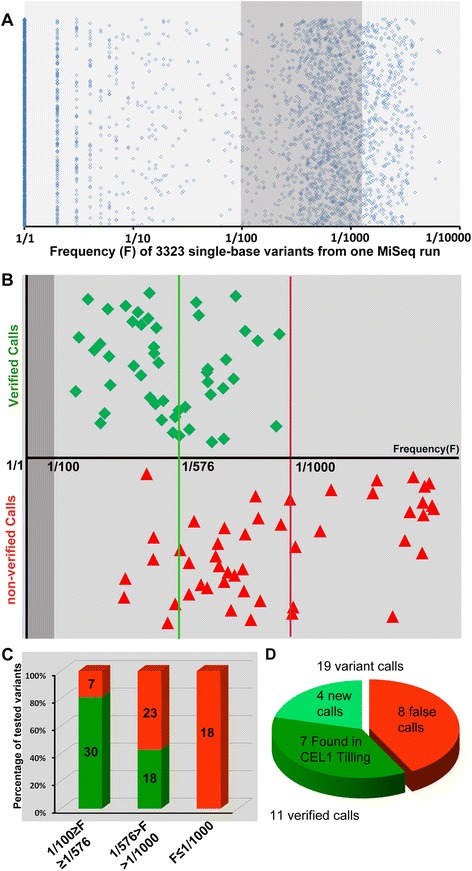
Figure 3.

Mutation distribution and validation. A: Frequency distribution of all variants from one MiSeq run after PELE analysis. 3323 variant calls were made by PELE analysis, ranging from 1/1 to 1/6513. We selected 96 putative variants that occurred at a frequency between 1:100 and 1:1500 for validation (shadowed area). B: Frequency of 96 variants chosen for validation using PoDATA. Green diamonds are variants that were confirmed as being genuine ENU-induced mutations; red triangles are variants that failed to be confirmed (false positives). The X axis shows the frequency with which each variant appeared within its pool. Variants in the dark grey area (F > 1/100) were filtered out as pre-existing polymorphisms. The vertical green line is the theoretical frequency for a unique ENU-induced mutation within a pool (1/576 alleles). The red line is the upper bound of verified calls (1/1000). C: Summary data in Figure 3B. Green bars represent confirmed variants, red bars are false positives in each of three frequency bins. D: Comparison of CEL1 vs NGS-TILLING using a control fragment. NGS-TILLING detected 19 variants of which 11 were verified (green) including all 7 mutations found previously using CEL1-based TILLING (darker green).
