Figure 2.

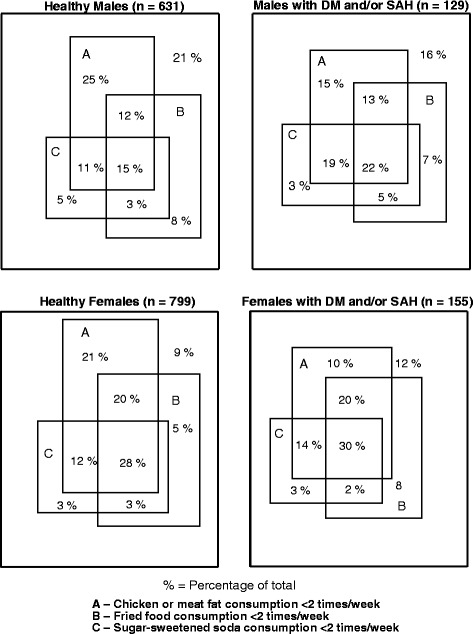
Venn diagram of dietary practices related to unhealthy food consumption. Stratified by the presence or not of diabetes mellitus and/or systemic arterial hypertension, and by gender. Florianópolis, Brazil, 2009.

Venn diagram of dietary practices related to unhealthy food consumption. Stratified by the presence or not of diabetes mellitus and/or systemic arterial hypertension, and by gender. Florianópolis, Brazil, 2009.