Figure 6.

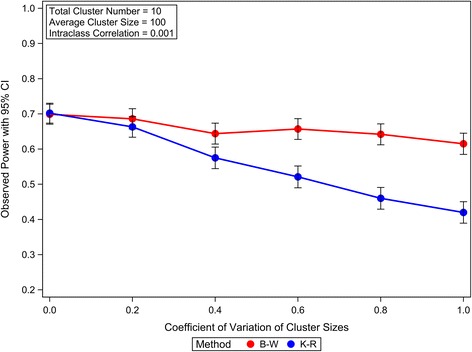
The effects of variation of cluster sizes on the power of GLMM Wald F tests in analyzing CRTs with few heterogeneous clusters. The observed powers and the 95% confidence intervals are calculated from 1000 independent simulation replicates.

The effects of variation of cluster sizes on the power of GLMM Wald F tests in analyzing CRTs with few heterogeneous clusters. The observed powers and the 95% confidence intervals are calculated from 1000 independent simulation replicates.