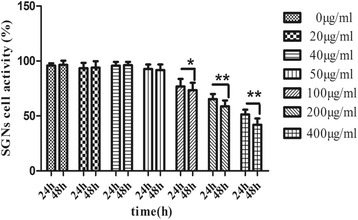
Figure 2.

LPS-induced cytotoxicity and cellular activity was measured by CCK-8. The 0 μg/ml group was defined as the control group. Compared with the control group, there were no significant statistical differences between the mean OD values of the 20, 40, and 50 μg/ml groups after 24 and 48 h. This might indicate that the SGN grew well under these three concentration levels of LPS. However, the mean OD values of the other groups (100, 200, 400 μg/ml) were less than that of the control group. The P values for both the 24- and 48-h exposures for the 100, 200, and 400 μg/ml groups were less than 0.05. The result indicated that the activity of the SGN was suppressed when the LPS concentration was over 50 μg/ml. The data are presented as the means ± SEM. *P < 0.05 compared to the control group; **P < 0.01 compared to the control group.
