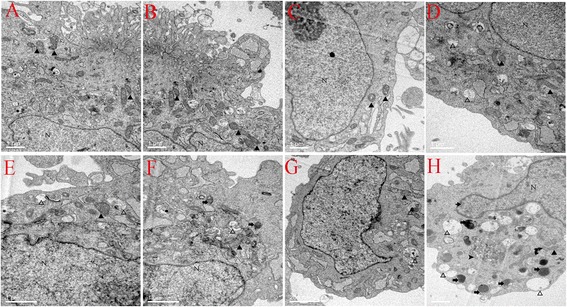
Figure 5.

RF-EMR-induced cellular ultrastructure changes. (A) 2 W/kg sham-exposure group; (B). 2 W/kg exposure group; (C) 4 W/kg sham-exposure group; (D) 4 W/kg exposure group; (E) 2 W/kg combined with LPS (40 μg/ml) sham-exposure group; (F) 2 W/kg combined with LPS (40 μg/ml) exposure group; (G) 4 W/kg combined with LPS (40 μg/ml) sham-exposure group; and (H) 4 W/kg combined with LPS (40 μg/ml) exposure group. Pictures A to G of ultrastructure show no obvious changes. However, in H picture, SGN’s cellular ultrastructure shows mitochondria vacuoles (show empty triangle), karyopyknosis (thin arrow), lysosome (thick arrow), and autophagosome (arrow head), black triangle: normal mitochondria, N: nucleus.
