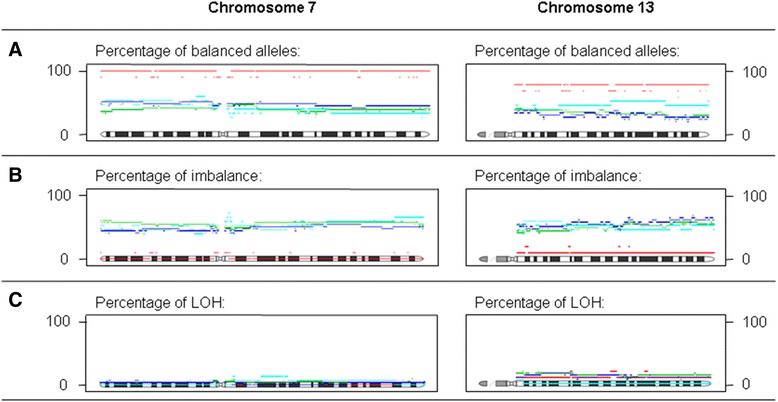
Figure 2.

Distribution of the allelic ratio groups on chromosome 7 and 13 in the discovery phase. Legend: - - - (Red broken line) = local recurrence group, - - - (Blue broken line) = distant recurrence group, - - - (Cyan broken line) = local and distant recurrence group, - - - = control group. The percentage of patients, divided into four groups according their recurrence status, with tumors that contain balanced alleles (A), imbalanced alleles (B), and LOH (C), spread along chromosomes 7 and 13.
