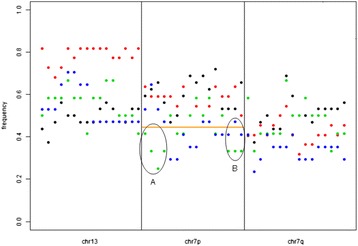
Figure 3.

Frequency of allelic imbalance or LOH at validated loci. The percentage of patients with loss (imbalanced alleles or LOH), spread along chromosomes 7 and 13. All SNPs below the orange line (— Orange Line) represent SNPs that presented with lower percentages of patients in only the L or LD groups. X-axis = from left to right, locations of SNPs along the chromosome (arms) Y-axis = the percentage of patients with imbalanced alleles or LOH (0 = > 0%, 1 = > 100%) ● = C group, (Red circle) = D group, (Green circle) = L group, (Blue circle) = LD group. A) Location on chromosome 7p (telomeric region) where the L group in particular showed a lower percentage of patients with imbalanced alleles or LOH compared to the other groups. B) Location on chromosome 7p (centromeric region) where both the L group as well as the LD group showed a lower percentage of patients with imbalanced alleles or LOH compared to the other groups.
