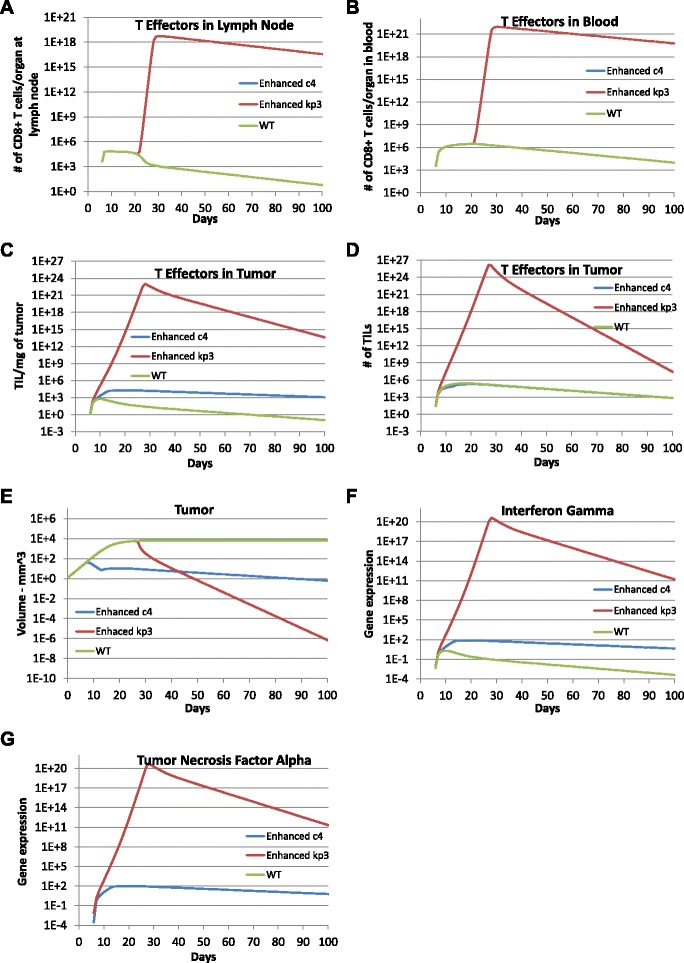
Fig. 6.

Improved one time vaccination effects with enhanced T cell cytotoxic ability or proliferation. Model predictions were obtained with enhanced T cell cytotoxic ability c 4=2.49×10⁵ (blue lines) and increased T cell proliferation rate k p3=5.73 (red lines). Results were compared to the model prediction obtained using calibrated parameter values as listed in Table 1 (green lines) to explore the impact of a single vaccination on day 5 after tumor implantation with dose 1.100481×10⁶ RLU per mm3 with enhanced T cell cytotoxic ability or local T cell proliferation. a TE1, b TE2, c TE3 expressed as cells per mg tumor, d TE3 expressed as total cells, e Total tumor cells (CMHCI+ + CMHCI-), f IFNG, and g TNFA
