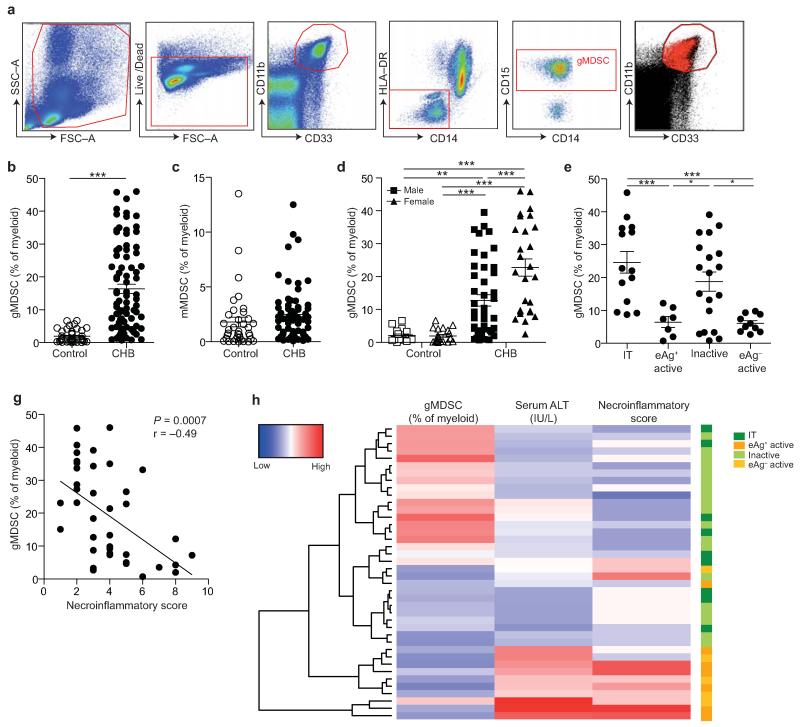
Figure 1. gMDSC expand in subjects replicating HBV in the absence of immunopathology.
a) Sequential gating strategy for gMDSC identification (CD11bhighCD33+HLA-DR−CD14−CD15+) using 11-color flow cytometry from freshly isolated PBMC (doublet discrimination not shown). gMDSC population (superimposed in red) was calculated as a percentage of myeloid cells (CD11bhighCD33+). Cumulative dot plots showing circulating b) gMDSC and c) mMDSC frequencies (n=44, healthy controls; n=84, CHB). d) gMDSC frequencies analyzed by gender. e) Summary plot of frequencies classified by disease phase using a subset of the cohort with clearly defined disease phases: 14 “immunotolerants” (HBeAg+, HBV DNA >107 IU/ml, ALT <40 IU/L), 9 “eAg+ active disease” (HBV DNA >5×10⁵ IU/ml, ALT >60 IU/L), 21 “inactive disease” (HBeAg−, HBV DNA <2000 IU/ml, ALT <40 IU/L), 11 “eAg− active disease” (HBeAg−, HBV DNA >5×10⁵ IU/ml, ALT >60 IU/L). f) gMDSC frequencies according to hepatic necroinflammatory score (n=42, CHB). g) Unsupervised hierarchical clustering using Euclidean distance; dendrogram displaying similarity between clusters. Clinically assigned disease phase, shown adjacent to plot; immunotolerant: dark green, eAg+ active disease: dark yellow, inactive disease: pale green, eAg− active disease: pale yellow (not used for analysis). Increasing color intensity (blue–red) corresponds to increasing gMDSC frequency, ALT (IU/L) or necroinflammatory score (n=42, CHB; maximum Knodell score in this cohort = 9/18). Error bars represent the mean ± SEM for the cohorts indicated; * p<0.05, ** p<0.01; *** p<0.001; b-c unpaired t test; d-e one way ANOVA (Tukey’s multiple comparisons test); f Pearson product-moment correlation coefficient.

