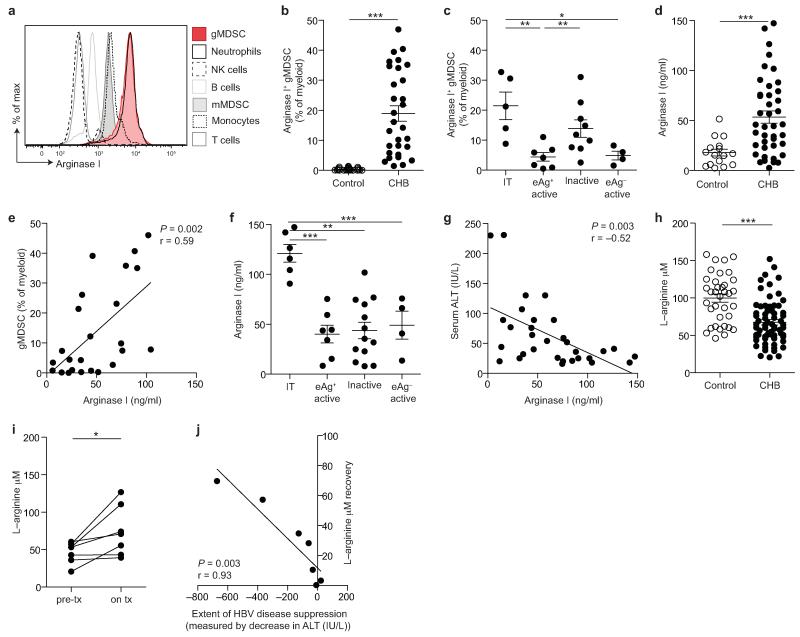
Figure 3. Arginase+ gMDSC and circulating arginase I increase in patients with HBV replication without immunopathology, whilst L-arginine levels decline.
a) Analysis of PBMC subpopulations for expression (MFI) of intracellular arginase I. Cellular fractions identified as: CD3−CD19+ B cells, CD14− CD16+CD15+ low density neutrophils, CD3+ T cells, CD3−CD56+ NK cells, HLA-DR+CD14+ monocytes, CD11bhighCD33+HLA-DRlowCD14+CD15− mMDSC. b) Cumulative data for percentage of arginase-I-expressing gMDSC as a proportion of total myeloid cells (CD11bhighCD33+; n=25, healthy controls; n=31, CHB). c) Arginase+ gMDSC as a percentage of total myeloid cells categorised by disease phase (defined in the legend to Figure 1). d) Serum arginase I (ng/ml) concentration, determined by ELISA (n=16, healthy controls; n=41, CHB). e) Correlation of serum arginase I with circulating gMDSC frequencies (n=24, CHB). Further cumulative analysis of the CHB cohort by: f) disease phase, g) serum ALT (IU/L). h) Tandem high-performance liquid chromatography mass spectrometry analysis of the L-arginine concentration (μM) in sera (n=38, healthy controls; n=71, CHB). i) L-arginine concentration (μM) in sera from 7 CHB pre– and on antiviral therapy (for >1 year) and j) correlation between decline in liver inflammation on therapy (ALT, IU/L) and recovery of L-arginine levels. Error bars represent the mean ± SEM for the cohorts indicated; * p<0.05, ** p<0.01; *** p<0.001; b, d, h unpaired t test, i paired t test, e, g, j Pearson product-moment correlation coefficient; c, f one way ANOVA (Tukey’s multiple comparisons test).

